








vincentarelbundock/modelsummary 322
Beautiful and customizable model summaries in R.
vincentarelbundock/countrycode 217
R package: Convert country names and country codes. Assigns region descriptors.
R package to download World Bank data
pkofod/QuantileRegressions.jl 27
Quantile regression in Julia
vincentarelbundock/Reinhart-Rogoff 26
Reinhart Rogoff replication files: Python stats with IPython notebook
vincentarelbundock/Rdatasets 15
A collection of datasets originally distributed in R packages
vincentarelbundock/marginsplot 8
plot marginal effects and predicted values using the `margins` and `ggplot2` libraries for `R`
Violets are BLUE. OLS is too. (R package)
Overseas Private Investment Corporation data on projects and insurance claims
push eventvincentarelbundock/modelsummary
commit sha 95a640d96eb643b5624ff4e520f48af5f2bb3def
table1 -> balance
push time in a day
issue commentvincentarelbundock/WDI
Thanks for the report. My intuition is that this is a different issue, since we are downloading a zipped CSV file, and not calling the API.
I can replicate the error on my computer, so this is obviously a real problem.
I'm having issues just downloading the CSV file from Firefox though, so my hunch is that the WB server is at fault here.
Somethings these things soft themselves out eventually. Otherwise, we'll have to send a support request to the WB.

comment created time in a day
push eventvincentarelbundock/modelsummary
commit sha 4cb73caeb5f19e6a58070951ce97d6a2b0d75c02
tibble depend and news
push time in 2 days
push eventvincentarelbundock/modelsummary
commit sha 728bc0a7dadb191e432bc0f56f7f6cddda2d7849
test artifacts
push time in 2 days
push eventvincentarelbundock/modelsummary
commit sha 8790198886748dff4d861b35cecc713b22dc4e5a
Built site for modelsummary: 0.6.1.9000@
push time in 3 days
push eventvincentarelbundock/modelsummary
commit sha bc4534286b329e9bac82a637d4b3d7442b11e4e7
balance bug + docs
push time in 3 days
issue closedvincentarelbundock/modelsummary
I love that table is printed to the viewer. Can this still happen even when save to tex, using output?
closed time in 3 days
gbekes
issue commentvincentarelbundock/modelsummary
I thought about this, and I think I'm going to stick with the current strategy of having output do only one thing.
output is already quite overloaded, since it can write a table to file, open a browser, display in the RStudio window. Making it do more than one thing at once runs the risk of confusing users, and I don't have a good idea for default behavior and for overriding that default behavior (what if I want to write to file but not see the table?). A good user experience here would require a fair amount of tweaking in the backend, and runs the risk of having to do lots of work just to complicate the user experience.
IMHO, repeating the command with a second time to write to file is not a huge burden, so I think I'll leave things as-is for now.
comment created time in 3 days
issue closedvincentarelbundock/modelsummary
Separate columns for horizontal stats
I have a long table in an article that requires I use horizontal statistics. I also wish to show confidence intervals instead of standard errors. Like this:
library(modelsummary)
#> Warning: package 'modelsummary' was built under R version 3.6.2

url <- 'https://vincentarelbundock.github.io/Rdatasets/csv/HistData/Guerry.csv'
dat <- read.csv(url)

models <- list()
models[['OLS 1']] <- lm(Literacy ~ Crime_prop + Infants, dat)
models[['OLS 2']] <- lm(Desertion ~ Crime_prop + Infants, dat)

msummary(models, statistic = 'conf.int', statistic_vertical = F)
<sup>Created on 2020-05-12 by the reprex package (v0.3.0)</sup>
One of my reviewers has asked that I try to line up the values in the confidence intervals so that the table is easier to read. I imagine that if I were to separate() the confidence intervals from the estimates I would be most of the way there. I am trying to avoid just building the table in pure LaTeX. Is there functionality to do this already?
closed time in 3 days
gregmacfarlane
issue commentvincentarelbundock/modelsummary
Separate columns for horizontal stats
I thought about this a lot, but unfortunately, it would be quite tricky to implement given the current internals. We can already present estimates side by side with confidence intervals, though not in two separate columns. This may not produce optimal outcomes, but a minor tweak with dcolumn can help a lot. I realize that this is not an ideal solution, but it would be a lot of work on my end for a somewhat niche feature.
Sorry!
comment created time in 3 days
issue closedvincentarelbundock/modelsummary
https://glin.github.io/reactable/index.html
closed time in 3 days
vincentarelbundock
issue commentvincentarelbundock/modelsummary
Doesn't work in a pipeable workflow. Would have to rely on ellipses which would be hacky. Probably not worth the trouble given that we alreayd have ton of options.
comment created time in 3 days
issue closedvincentarelbundock/modelsummary
datasummary_balance add_columns produces warning
closed time in 3 days
vincentarelbundock
issue commentvincentarelbundock/modelsummary
datasummary_balance add_columns produces warning
https://github.com/vincentarelbundock/modelsummary/commit/7104ade5b1afc249332e4c92ded7b1f79f78fc62
comment created time in 3 days
push eventvincentarelbundock/modelsummary
commit sha 7104ade5b1afc249332e4c92ded7b1f79f78fc62
datasummary_balance refactor
push time in 3 days
push eventvincentarelbundock/modelsummary
commit sha 13f362735fdb7a6019fa530004cc4a9780d206d2
datasummary_balance refactor
push time in 3 days
push eventvincentarelbundock/modelsummary
commit sha 10a34198e4e3b33e5d195385220a70b56ec58787
relax tibble dependency
push time in 6 days
push eventvincentarelbundock/modelsummary
commit sha bf89b87cd7f64c763a25ae736d1b1aa258d82463
relax tibble dependency
push time in 6 days
push eventvincentarelbundock/modelsummary
commit sha e1ae0d9fb670e98e8715c41adf596052380a658a
drop gt version
push time in 6 days
push eventvincentarelbundock/modelsummary
commit sha 2a5ae550f1d47b7bf10360b2a38d536525a5f4fe
no magrittr depends
push time in 6 days
push eventvincentarelbundock/modelsummary
commit sha 8b9791697a1763e05993176212fa973807756151
rmarkdown suggests
push time in 6 days
issue commentvincentarelbundock/modelsummary
`datasummary_skim` support `type="date"`
Alright. Will keep my eyes open in case I run across something.
But the day job is calling, so it might be a little while before I react to this one.
comment created time in 7 days
issue closedvincentarelbundock/modelsummary
`datasummary_skim`: misc issues
Reported via email:
#1
datasummary_skim(data, type='numeric', histogram = TRUE) -->and instead of a histogram, it has "<U+2587>" I changed locale to US, but no change (Windows 10 + R 4.0.2 + RStudio Version 1.3.1073).#2 I wonder if there was a way to include [Date].
#3 + 1 minor thing. when we run datasummary_skim(data, type="categorical") and there is no categorical, it says: "Error in datasummary(formula = f, data = dat_new, output = output, title = title, : No levels in 'x'!"
Maybe a better output would just say, maybe you don't have categorical variables. Because, I might have stored year as numeric while i thought it was categorical...
just as I sent, I tried it on a smaller set, and there I had Error in datasummary_skim(data2, type = "categorical") : datasummary_skim(type="categorical") only works with logical, character, and factor variables. There is such variable in your dataset.
so the other error, I realized was, when a variable had just NA's as values. I'd consider adding it as a factor value, or maybe allow user deciding whether to allow NA as factor value or not.
closed time in 7 days
vincentarelbundock
issue commentvincentarelbundock/modelsummary
`datasummary_skim`: misc issues
Fantastic!
Conditional formatting sounds super cool, but I'll have to think about it a bit. Will close this issue for now. Feel free to open new ones with specific requests.
comment created time in 7 days
push eventvincentarelbundock/modelsummary
commit sha d47d1d156b92dc5b2187cd385180169d700ec370
unique and missing in datasummary_skim
commit sha b767b83175c35f46d3fa0e38c1e115687e22c029
Merge branch 'histogram'
push time in 7 days
issue commentvincentarelbundock/modelsummary
`datasummary_skim` support `type="date"`
Min, Max and format would be very easy to implement.
Not sure how I would go about finding the gaps. If the dataset is "rectangular", with NA instead of dates where there are holes, then this is a trivial case of % missing. However, if the missing have been excluded, I would have to (a) infer the time series frequency, (b) define a sequence of time points that we should observe, and (c) check if those data points are there.
My (somewhat limited) experience with time series data suggests that tasks (a) and (b) are non-trivial. Times series data are often highly irregular, so it's not always obvious what the user would consider a gap.
Have you seen a function in R that does what you want (i.e., finds the number of gaps in times series with arbitrary format and frequencies)?
comment created time in 7 days
issue commentvincentarelbundock/modelsummary
`datasummary_skim`: misc issues
Thanks for these suggestions! A few thoughts:
The main design goal of datasummary_skim is to offer a "canned", or "one-size-fits-all" summary function. A secondary design goal is to produce a beautiful output. That means we cannot add a large number of summaries, otherwise the table would become too cluttered.
That said I think there is a case for Missing% and Unique#, so I'm leaning toward including those.
With respect to Min/Max vs. P01/P99, I agree with you on principles that this would be better in cases with extreme values. However, (a) I think the vast majority of users will want to display Min/Max, and (b) I feel like the built-in histogram can guard against the most egregious problems that we can expect in this respect.
Finally, I recognize that my "one-size-fits-all" will not actually fit everyone's needs. For this reason, I also offer a super powerful and massively customizable function called datasummary, which allow people to build their own summary tables, and which can accept arbitrary functions. See here for details: https://vincentarelbundock.github.io/modelsummary/articles/datasummary.html#datasummary-1
With datasummary, it would be trivial to define a function to produce a new column with a "range" string like this "[0, 100]" or any other data summary you like.
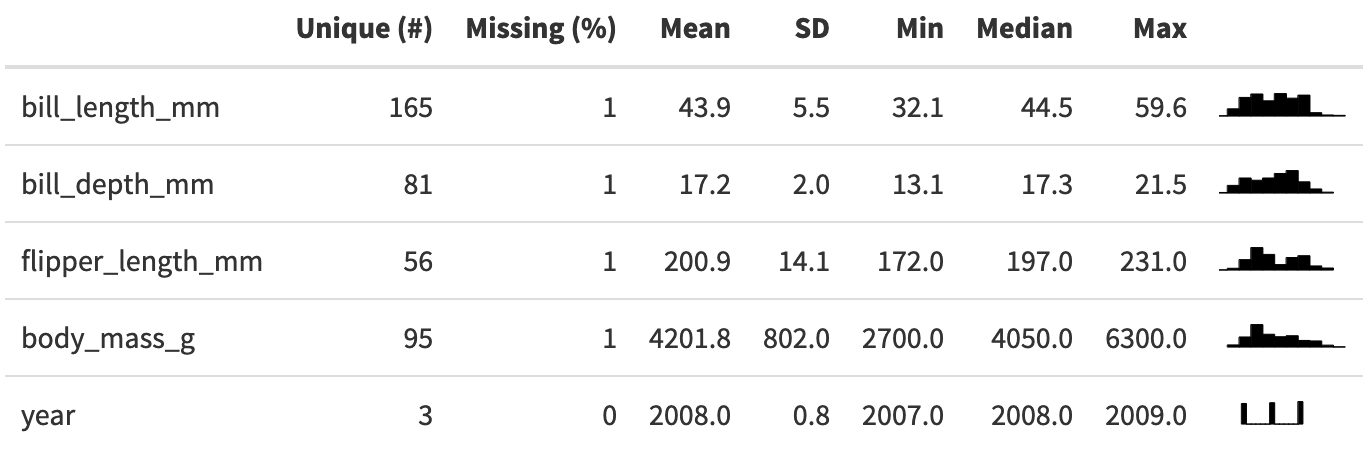
For datasummary_skim, I'm now leaning towards this look. Given all of the above, what do you think? Would appreciate any comments you may have!
comment created time in 7 days
push eventvincentarelbundock/modelsummary
commit sha d47d1d156b92dc5b2187cd385180169d700ec370
unique and missing in datasummary_skim
push time in 7 days
pull request commenttidymodels/broom
This looks really great; thanks for all the efforts!
FWIW, one of the ivreg contributors recently wrote on twitter that it might take a while for AER to switch over. So it probably makes sense to include those new tidiers before then.
Also, since component="instruments" is already a convenience subseting-type of feature, I wonder if it would make sense to also allow both stages, or stage2+instruments, either with a new component name, or by setting several.ok=TRUE in match.arg.
Again, thanks for this. I look forward to using it!

comment created time in 7 days
issue closedvincentarelbundock/modelsummary
Hi,
Congratulations on the beautiful package!
We ( @michaelquinn32 and I) noticed your datasummary_skim() function the output of which looks a lot like that for skimr::skim(). Was it inspired by our package? It's pretty complex to maintain the package because of things like Windows not supporting UTF-8 in data frames which makes the histograms impossible. It might be simpler to use skimr directly. Would you be interested in a PR to support a customized skimmer using skimr? Did you run into an issue trying to do that?
closed time in 8 days
elinw
issue commentvincentarelbundock/modelsummary
Sounds great! Thanks again for your suggestions! I will definitely consider switching at some point if I run into too many data-handling issues. For now, I have:
- Added a shout-out to
skimrin the docs - Modified the output somewhat to include Min-Med-Max instead of all quartiles
- Moved to
kableExtra'sspec_hist, which gives me automatic support for Windows, but no support for markdown histograms (but support for HTML and Rmarkdown PDF+HTML).


comment created time in 8 days
push eventvincentarelbundock/modelsummary
commit sha 25b2c6415f57aa0ca26010b377750fc6efda303d
Update README.md
push time in 8 days
issue commentvincentarelbundock/modelsummary
`datasummary_skim`: misc issues
@gbekes I believe that the two main issues raised in this thread have been resolved by recent commits to github. When datasummary_skim cannot handle a particular variable or dataset, informative warnings should generally returned. Obviously, I can't be 100% certain this will always work, but I tested datasummary_skim with the 1400 datasets of the Rdatasets repository and it worked fine there in all of them, or returned an appropriate error.
If you want to try it you can install from Github:
library(remotes)
install_github("vincentarelbundock/modelsummary")
Make sure you restart the R session completely before trying.
I am not certain what to do with date support yet, but I have a opened a specific issue for this.
https://github.com/vincentarelbundock/modelsummary/issues/138
comment created time in 8 days
issue openedvincentarelbundock/modelsummary
`datasummary_skim` support `type="date"`
created time in 8 days
issue commentvincentarelbundock/modelsummary
The easiest way to do this would probably be to divide your weights by the sum of weights in the subgroup over which you want to marginalize (i.e., in the subgroup where the sum of frequencies should equal 100%). Then, you just take the sum of these new weights.
Does something like this work for you?
library(tidyverse)
library(modelsummary)

data <- readRDS("table_example.rds") %>%
        group_by(redcap_event_name, age_group, selection) %>%
        mutate(weights = weights / sum(weights) * 100)

f <- Factor(dcany) + Factor(dcanyanx) + 1 ~
     sum * weights * redcap_event_name * age_group * selection * DropEmpty()
datasummary(f, data)


comment created time in 8 days
push eventvincentarelbundock/modelsummary
commit sha 02b92a87855ad4cbfb0dabf7cf3bfc835279f82d
images histograms
commit sha f2b7c2d8388cbecc07188946ae1c2edb3d5e5701
datasummary_skim bugs and safety drop=FALSE
commit sha edd5ce8d668cbbf3e451cf9c6c770d202448b231
datasummary_skim histogram support
commit sha 6b8c1bf55e8eff2c57daf5c2631e1927a71d6a64
Merge branch 'master' into histogram
commit sha 2e8a5a7dbed5d52fcd7966ffcd00ec9c4bde44c5
datasummary_skim input checking and docs
commit sha acabbdd900b76d22e9c1522e20839a72b78b2d4a
sanity_output for datasummary
commit sha 5c8c5382f9193fe6c3e8ce704bf9a76295d45320
bug in datasummary_skim cat selection
commit sha e27712e11da9df776635dec9488e2187b73985c6
guard against corner cases
commit sha b7afc8c54858f585ec4733633b63021d21e435df
docs
commit sha 0b4c160b706a5d8377d31ab785b529fc015a2792
pctformat
commit sha 12c634aaad326a2111311b895c201da5b3a530f9
tests for datasummary and factor breakage
push time in 9 days
issue closedvincentarelbundock/modelsummary
- [x]
datasummary_skim(type="categorical")does not work when some factor levels are equal to "" - [x] fully NA column (character or logical)
- [x] very large number of columns causes C stack breakage
- [x] categorical with many factors does weird things. check palmerpenguins
closed time in 9 days
vincentarelbundock
push eventvincentarelbundock/modelsummary
commit sha 12c634aaad326a2111311b895c201da5b3a530f9
tests for datasummary and factor breakage
push time in 9 days
push eventvincentarelbundock/modelsummary
commit sha 0b4c160b706a5d8377d31ab785b529fc015a2792
pctformat
push time in 9 days
push eventvincentarelbundock/modelsummary
commit sha b7afc8c54858f585ec4733633b63021d21e435df
docs
push time in 9 days
issue closedvincentarelbundock/modelsummary
- [x]
datasummary_skim(type="categorical")does not work when some factor levels are equal to "" - [x] fully NA column (character or logical)
- [x] very large number of columns causes C stack breakage
closed time in 9 days
vincentarelbundock
issue commentvincentarelbundock/modelsummary
https://github.com/vincentarelbundock/modelsummary/commit/e27712e11da9df776635dec9488e2187b73985c6
comment created time in 9 days
push eventvincentarelbundock/modelsummary
commit sha e27712e11da9df776635dec9488e2187b73985c6
guard against corner cases
push time in 9 days
issue openedvincentarelbundock/modelsummary
datasummary_skim(type="categorical")does not work when some factor levels are equal to ""
created time in 9 days
push eventvincentarelbundock/modelsummary
commit sha 5c8c5382f9193fe6c3e8ce704bf9a76295d45320
bug in datasummary_skim cat selection
push time in 9 days
push eventvincentarelbundock/modelsummary
commit sha acabbdd900b76d22e9c1522e20839a72b78b2d4a
sanity_output for datasummary
push time in 10 days
push eventvincentarelbundock/modelsummary
commit sha 311380d0e24ac31ef2f541d080f36437dc34182c
sanity_output for datasummary
push time in 10 days
issue closedvincentarelbundock/modelsummary
Ordering of terms in `modelsummary` for mixed-effect models (with `broom.mixed`)
Hi,
Thank you for the wonderful package! I'm currently using it for my teaching of mixed-effect model with the lme4 package in R. Because the broom package does not natively support objects from lme4, I rely on the method provided by the broom.mixed package. One issue I found, however, is that msummary() will mess up the order of the coefficients:
library(broom.mixed)
#> Registered S3 method overwritten by 'broom.mixed':
#>   method      from
#>   tidy.gamlss broom
library(lme4)
#> Loading required package: Matrix
library(modelsummary)
fm1 <- lmer(Reaction ~ Days + (Days | Subject), sleepstudy)
msummary(fm1, output = "markdown")
<table> <thead> <tr class="header"> <th style="text-align: left;"></th> <th style="text-align: left;">Model 1</th> </tr> </thead> <tbody> <tr class="odd"> <td style="text-align: left;">(Intercept)</td> <td style="text-align: left;">251.405</td> </tr> <tr class="even"> <td style="text-align: left;"></td> <td style="text-align: left;">(6.825)</td> </tr> <tr class="odd"> <td style="text-align: left;">cor__(Intercept).Days</td> <td style="text-align: left;">0.066</td> </tr> <tr class="even"> <td style="text-align: left;"></td> <td style="text-align: left;"></td> </tr> <tr class="odd"> <td style="text-align: left;">Days</td> <td style="text-align: left;">10.467</td> </tr> <tr class="even"> <td style="text-align: left;"></td> <td style="text-align: left;">(1.546)</td> </tr> <tr class="odd"> <td style="text-align: left;">sd__(Intercept)</td> <td style="text-align: left;">24.741</td> </tr> <tr class="even"> <td style="text-align: left;"></td> <td style="text-align: left;"></td> </tr> <tr class="odd"> <td style="text-align: left;">sd__Days</td> <td style="text-align: left;">5.922</td> </tr> <tr class="even"> <td style="text-align: left;"></td> <td style="text-align: left;"></td> </tr> <tr class="odd"> <td style="text-align: left;">sd__Observation</td> <td style="text-align: left;">25.592</td> </tr> <tr class="even"> <td style="text-align: left;"></td> <td style="text-align: left;"></td> </tr> <tr class="odd"> <td style="text-align: left;">AIC</td> <td style="text-align: left;">1755.6</td> </tr> <tr class="even"> <td style="text-align: left;">BIC</td> <td style="text-align: left;">1774.8</td> </tr> <tr class="odd"> <td style="text-align: left;">Log.Lik.</td> <td style="text-align: left;">-871.814</td> </tr> <tr class="even"> <td style="text-align: left;">REMLcrit</td> <td style="text-align: left;">1743.628</td> </tr> </tbody> </table>
<sup>Created on 2020-09-12 by the reprex package (v0.3.0)</sup>
For mixed-effect models generally we report the fixed effects before the random effects (i.e., those started with cor__ or sd__), but because msummary() will order the coefficients in alphabetical order, it puts those with cor__ before other fixed effect coefficients, and it is tedious to reorder them using coef_map. Therefore, would it be possible to have an option to not automatically order the coefficients? Or maybe there are other methods to solve this? Thank you very much!
Mark
closed time in 10 days
marklhc
issue commentvincentarelbundock/modelsummary
Ordering of terms in `modelsummary` for mixed-effect models (with `broom.mixed`)
Great!
comment created time in 10 days
push eventvincentarelbundock/modelsummary
commit sha 15ebac345e0b1d313acf502f926592d402bcc994
preserve coefficient order
commit sha e54b9ed424ea39e120660cd77f70c6dc7c4228e8
datasummary_df
commit sha 6b8c1bf55e8eff2c57daf5c2631e1927a71d6a64
Merge branch 'master' into histogram
commit sha 2e8a5a7dbed5d52fcd7966ffcd00ec9c4bde44c5
datasummary_skim input checking and docs
push time in 10 days
issue closedhaozhu233/kableExtra
Save SVG files from `spec_hist`, `spec_boxplot`, `spec_line`
Hi,
I’m loving the mini-plots.
I would like to save a LaTeX table with histograms for later use. Right now, my problem is that there does not seem to be a way to save the SVG files, because SVGs are deleted automatically.
One possibility would be to modify those three lines of code to unlink only if dir was not specified explicitly by the user.
https://github.com/haozhu233/kableExtra/blob/master/R/mini_plots.R#L82 https://github.com/haozhu233/kableExtra/blob/master/R/mini_plots.R#L199 https://github.com/haozhu233/kableExtra/blob/master/R/mini_plots.R#L359
That way we could specify a directory to store SVG files, and those could be used for LaTeX compilation at a later stage.
What do you think?
library(kableExtra)

mpg_list <- split(mtcars$mpg, mtcars$cyl)
inline_plot <- data.frame(cyl = c(4, 6, 8), mpg_box = "", mpg_hist = "")
inline_plot %>%
  kbl(booktabs = T) %>%
  kable_paper(full_width = F) %>%
  column_spec(2, image = spec_boxplot(mpg_list, dir="test_hist")) %>%
  column_spec(3, image = spec_hist(mpg_list, dir="test_box"))
closed time in 10 days
vincentarelbundock
issue commenthaozhu233/kableExtra
Save SVG files from `spec_hist`, `spec_boxplot`, `spec_line`
Great thanks. I'll watch the other thread as I'm very interested in those development.
As always, thanks for all your work on this!
comment created time in 10 days
push eventvincentarelbundock/modelsummary
commit sha e54b9ed424ea39e120660cd77f70c6dc7c4228e8
datasummary_df
push time in 10 days
issue commentvincentarelbundock/modelsummary
Ordering of terms in `modelsummary` for mixed-effect models (with `broom.mixed`)
I hope to have now fixed this problem. When you have a minute, would you mind installing from Github, restarting your R session and trying again?
library(remotes)
install_github('vincentarelbundock/modelsummary')
Restart R session completely. Then,
library(broom.mixed)
library(lme4)
library(modelsummary)
fm1 <- lmer(Reaction ~ Days + (Days | Subject), sleepstudy)
msummary(fm1, output = "markdown")
<table> <thead> <tr class="header"> <th style="text-align: left;"></th> <th style="text-align: left;">Model 1</th> </tr> </thead> <tbody> <tr class="odd"> <td style="text-align: left;">(Intercept)</td> <td style="text-align: left;">251.405</td> </tr> <tr class="even"> <td style="text-align: left;"></td> <td style="text-align: left;">(6.825)</td> </tr> <tr class="odd"> <td style="text-align: left;">Days</td> <td style="text-align: left;">10.467</td> </tr> <tr class="even"> <td style="text-align: left;"></td> <td style="text-align: left;">(1.546)</td> </tr> <tr class="odd"> <td style="text-align: left;">sd__(Intercept)</td> <td style="text-align: left;">24.741</td> </tr> <tr class="even"> <td style="text-align: left;"></td> <td style="text-align: left;"></td> </tr> <tr class="odd"> <td style="text-align: left;">cor__(Intercept).Days</td> <td style="text-align: left;">0.066</td> </tr> <tr class="even"> <td style="text-align: left;"></td> <td style="text-align: left;"></td> </tr> <tr class="odd"> <td style="text-align: left;">sd__Days</td> <td style="text-align: left;">5.922</td> </tr> <tr class="even"> <td style="text-align: left;"></td> <td style="text-align: left;"></td> </tr> <tr class="odd"> <td style="text-align: left;">sd__Observation</td> <td style="text-align: left;">25.592</td> </tr> <tr class="even"> <td style="text-align: left;"></td> <td style="text-align: left;"></td> </tr> <tr class="odd"> <td style="text-align: left;">AIC</td> <td style="text-align: left;">1755.6</td> </tr> <tr class="even"> <td style="text-align: left;">BIC</td> <td style="text-align: left;">1774.8</td> </tr> <tr class="odd"> <td style="text-align: left;">Log.Lik.</td> <td style="text-align: left;">-871.814</td> </tr> <tr class="even"> <td style="text-align: left;">REMLcrit</td> <td style="text-align: left;">1743.628</td> </tr> </tbody> </table>
comment created time in 10 days
push eventvincentarelbundock/modelsummary
commit sha 15ebac345e0b1d313acf502f926592d402bcc994
preserve coefficient order
push time in 10 days
push eventvincentarelbundock/Rdatasets
commit sha 0e831c9dee4ebc28952565d23e9babe925098af7
Built site for Rdatasets: 1.0.0@
push time in 10 days
push eventvincentarelbundock/Rdatasets
commit sha 2f652517b805ebee4cf4302c15ad9e64fd2aa858
AER
push time in 10 days
push eventvincentarelbundock/Rdatasets
commit sha fa3f949bd6e6297ebb90944726cc5dced76470e6
new package AER
push time in 10 days
issue commentvincentarelbundock/modelsummary
If you give me an example with real data that I can replicate, and possibly the survey package command you want to emulate, then I will almost certainly find a solution for you.
On Sun, Sep 13, 2020, at 08:22, andresimi wrote:
Hi, is it possible to apply a weight to have weighted frequencies in modelsummary? Or to work with survey data from survey package? thanx
— You are receiving this because you are subscribed to this thread. Reply to this email directly, view it on GitHub https://github.com/vincentarelbundock/modelsummary/issues/136, or unsubscribe https://github.com/notifications/unsubscribe-auth/AAHQ7MLREA5R5ROVHBL4NWTSFS2PLANCNFSM4RKUGR7Q.
-- Vincent Arel-Bundock
Professeur agrégé / Associate professor http://arelbundock.com Université de Montréal, Science politique 3150 rue Jean-Brillant, Pav. Lionel-Groulx, C-4020 Montréal, Québec, Canada, H3T 1N8
comment created time in 10 days
issue commentvincentarelbundock/modelsummary
Ordering of terms in `modelsummary` for mixed-effect models (with `broom.mixed`)
Oh right, I had completely forgotten about that. Thanks for the useful digging!
This should be very easy to fix. I should be able to push an update sometime this week.
On Sat, Sep 12, 2020, at 15:57, Hok Chio (Mark) Lai wrote:
Thanks for getting back to me quickly! Actually I think
msummary()does sort the coefficient by names. Here is an example
library(modelsummary) msummary(lm(Girth ~ Volume + Height, data = trees), output = "markdown")Model 1 (Intercept) 10.816 (1.973) Height -0.045 (0.028) Volume 0.195 (0.011) Num.Obs. 31 R2 0.941 R2 Adj. 0.937 AIC 78.2 BIC 84.0 Log.Lik. -35.116 F 222.471 Created on 2020-09-12 by the reprex package https://reprex.tidyverse.org/ (v0.3.0)As you can see,
Heightwas placed beforeVolume, even though in the model it's the other way round.Upon further investigation, I think it has to do with this line in the
modelsummary:::extract_estimates()function:est <- est %>% tidyr::pivot_longer(-term, names_to = "statistic") %>% dplyr::arrange(term, statistic)The
arrange()function sorts the terms in the table.Thank you again! It's such a great package!
— You are receiving this because you commented. Reply to this email directly, view it on GitHub https://github.com/vincentarelbundock/modelsummary/issues/135#issuecomment-691538040, or unsubscribe https://github.com/notifications/unsubscribe-auth/AAHQ7MNTXMIOLZF5F5LJK5TSFPHD3ANCNFSM4RJZW5AA.
-- Vincent Arel-Bundock
Professeur agrégé / Associate professor http://arelbundock.com Université de Montréal, Science politique 3150 rue Jean-Brillant, Pav. Lionel-Groulx, C-4020 Montréal, Québec, Canada, H3T 1N8
comment created time in 10 days
issue commentvincentarelbundock/modelsummary
Ordering of terms in `modelsummary` for mixed-effect models (with `broom.mixed`)
Thanks a lot for the report! And thanks for trying modelsummary!
I don’t have access to a computer right now, so I can’t check. But in principle, modelsummary should not do any sorting, and should report parameters in the same order as tidy. Is they the case? Does boom.mixed’s tidy function produce a different order?
In any case, standard mechanism for reordering parameters is coef_map. Would they work for you? (see the docs or website for many examples).
On Sat, Sep 12, 2020, at 14:15, Hok Chio (Mark) Lai wrote:
Hi,
Thank you for the wonderful package! I'm currently using it for my teaching of mixed-effect model with the
lme4package in R. Because thebroompackage does not natively support objects fromlme4, I rely on the method provided by thebroom.mixedpackage. One issue I found, however, is thatmsummary()will mess up the order of the coefficients:
library(broom.mixed) #> Registered S3 method overwritten by 'broom.mixed': #> method from #> tidy.gamlss broom library(lme4) #> Loading required package: Matrix library(modelsummary) fm1 <- lmer(Reaction ~ Days + (Days | Subject), sleepstudy) msummary(fm1, output = "markdown")Model 1 (Intercept) 251.405 (6.825) cor__(Intercept).Days 0.066 Days 10.467 (1.546) sd__(Intercept) 24.741 sd__Days 5.922 sd__Observation 25.592 AIC 1755.6 BIC 1774.8 Log.Lik. -871.814 REMLcrit 1743.628 Created on 2020-09-12 by the reprex package https://reprex.tidyverse.org/ (v0.3.0)For mixed-effect models generally we report the fixed effects before the random effects (i.e., those started with
cor__orsd__), but becausemsummary()will order the coefficients in alphabetical order, it puts those withcor__before other fixed effect coefficients, and it is tedious to reorder them usingcoef_map. Therefore, would it be possible to have an option to not automatically order the coefficients? Or maybe there are other methods to solve this? Thank you very much!Mark
— You are receiving this because you are subscribed to this thread. Reply to this email directly, view it on GitHub https://github.com/vincentarelbundock/modelsummary/issues/135, or unsubscribe https://github.com/notifications/unsubscribe-auth/AAHQ7MMF24JGZ62QCGVWILLSFO3ENANCNFSM4RJZW5AA.
-- Vincent Arel-Bundock
Professeur agrégé / Associate professor http://arelbundock.com Université de Montréal, Science politique 3150 rue Jean-Brillant, Pav. Lionel-Groulx, C-4020 Montréal, Québec, Canada, H3T 1N8
comment created time in 11 days
issue commentvincentarelbundock/modelsummary
FYI, I have some prototype code using kableExtra's new inline plot functionality. Please don't invest time in a PR until I decide if I want to move away from unicode to inline svg.
In any case, I plan to (a) change the output somewhat so it differs from skim, and (2) add an explicit mention to skimr in the detailed description of the function so that people know the intellectual origin when they type datasummary_skim.
I'll keep you updated on whether I move to skimr or kableExtra.
Thanks again,.
comment created time in 11 days
push eventvincentarelbundock/modelsummary
commit sha edd5ce8d668cbbf3e451cf9c6c770d202448b231
datasummary_skim histogram support
push time in 11 days
issue openedhaozhu233/kableExtra
Save SVG files from `spec_hist`, `spec_boxplot`, `spec_line`
Hi,
I’m loving the mini-plots.
I would like to save a LaTeX table with histograms for later use. Right now, my problem is that there does not seem to be a way to save the SVG files, because SVGs are deleted automatically.
One possibility would be to modify those three lines of code to unlink only if dir was not specified explicitly by the user.
https://github.com/haozhu233/kableExtra/blob/master/R/mini_plots.R#L82 https://github.com/haozhu233/kableExtra/blob/master/R/mini_plots.R#L199 https://github.com/haozhu233/kableExtra/blob/master/R/mini_plots.R#L359
That way we could specify a directory to store SVG files, and those could be used for LaTeX compilation at a later stage.
What do you think?
library(kableExtra)

mpg_list <- split(mtcars$mpg, mtcars$cyl)
inline_plot <- data.frame(cyl = c(4, 6, 8), mpg_box = "", mpg_hist = "")
inline_plot %>%
  kbl(booktabs = T) %>%
  kable_paper(full_width = F) %>%
  column_spec(2, image = spec_boxplot(mpg_list, dir="test_hist")) %>%
  column_spec(3, image = spec_hist(mpg_list, dir="test_box"))
created time in 11 days
push eventvincentarelbundock/modelsummary
commit sha f2b7c2d8388cbecc07188946ae1c2edb3d5e5701
datasummary_skim bugs and safety drop=FALSE
push time in 12 days
issue commentvincentarelbundock/modelsummary
`datasummary_skim`: misc issues
Note that writing to file does not work in this branch. Right now, I'm just worried about histogram displaying correctly on Windows.
comment created time in 12 days
issue commentvincentarelbundock/modelsummary
Note that writing to file does not work in this branch. Right now, I'm just worried about histogram displaying correctly on Windows.
comment created time in 12 days
issue commentvincentarelbundock/modelsummary
Yes!
One of the important design feature of modelsummary is that it gives sensible default, and then delegates further customization to external packages (kableExtra by default). This makes the package easy to use, but also infinitely customizable. You can read a rundown of the LaTeX customization features here:
https://haozhu233.github.io/kableExtra/awesome_table_in_pdf.pdf
Note that the modelsummary(output="file.tex") is a "quick write" strategy; it writes to file immediately without considering any of the functions you call after modelsummary. If you want to use kableExtra to customize your table, you'll need to save it using save_kable. The documentation describes this quite clearly. You can find examples here:
https://vincentarelbundock.github.io/modelsummary/articles/modelsummary.html#customizing-the-look-of-your-table-1
comment created time in 12 days
issue commentvincentarelbundock/modelsummary
`datasummary_skim`: misc issues
Oh, I understand what you mean now! Will think about it.
BTW, I'm working on an update to properly support histograms in Windows (through .svg images instead of unicode characters). The problem is I don't have access to a Windows computer at home to test it out (and the office is closed).
If you get a chance, would you mind testing the new version by installing my "histogram" branch with this command:
library(remotes)
install_github('vincentarelbundock/modelsummary@histogram')
Then restart R completely and try some code like this:
library(modelsummary)
library(palmerpenguins)

datasummary_skim(penguins)
datasummary_skim(penguins, "categorical")
comment created time in 12 days
issue commentvincentarelbundock/modelsummary
Oh yes, this last one I caught already. If you install from Github you'll see this error message:
Error in sanity_output(output) : The
outputargument must be default, gt, kableExtra, flextable, huxtable, html, latex, markdown, dataframe, data.frame, or a valid file path with one of these extensions: html, tex, md, txt, docx, pptx, rtf, jpg, png
comment created time in 12 days
push eventvincentarelbundock/modelsummary
commit sha 02b92a87855ad4cbfb0dabf7cf3bfc835279f82d
images histograms
push time in 12 days
issue commentvincentarelbundock/modelsummary
`datasummary_skim`: misc issues
These issues make me think that https://github.com/vincentarelbundock/modelsummary/issues/132 might be a very good idea.
comment created time in 12 days
issue openedvincentarelbundock/modelsummary
`datasummary_skim`: misc issues
Reported via email:
#1
datasummary_skim(data, type='numeric', histogram = TRUE) -->and instead of a histogram, it has "<U+2587>" I changed locale to US, but no change (Windows 10 + R 4.0.2 + RStudio Version 1.3.1073).#2 I wonder if there was a way to include [Date].
#3 + 1 minor thing. when we run datasummary_skim(data, type="categorical") and there is no categorical, it says: "Error in datasummary(formula = f, data = dat_new, output = output, title = title, : No levels in 'x'!"
Maybe a better output would just say, maybe you don't have categorical variables. Because, I might have stored year as numeric while i thought it was categorical...
just as I sent, I tried it on a smaller set, and there I had Error in datasummary_skim(data2, type = "categorical") : datasummary_skim(type="categorical") only works with logical, character, and factor variables. There is such variable in your dataset.
so the other error, I realized was, when a variable had just NA's as values. I'd consider adding it as a factor value, or maybe allow user deciding whether to allow NA as factor value or not.
created time in 12 days
issue commentvincentarelbundock/modelsummary
Thanks a lot for the report! This is obviously an important feature. I pushed an update to the package. Could you please install from Github and try it to see if it works as expected?
library(remotes)
install_github('vincentarelbundock/modelsummary')
Then restart your R session completely and run something like this:
library(modelsummary)
library(sandwich)

mod <- list(lm(hp ~ mpg + drat, mtcars),
            lm(hp ~ mpg + drat, mtcars))
so <- list(vcov, vcovHC)
modelplot(mod, statistic_override=so, conf_level=.87)


comment created time in 12 days
push eventvincentarelbundock/modelsummary
commit sha d032da2abfba3546204e26a6fce92c7d6256b61a
vdiffr from cran
push time in 13 days
push eventvincentarelbundock/modelsummary
commit sha 004c850cd9976ae20e23cf2b155b90a5a9fa47d9
statistic_override refactor
commit sha cdf0d0a80ff0b777df3de5cd4808f66a530f8308
statistic_override refactor + modelplot argument
push time in 13 days
issue commentvincentarelbundock/modelsummary
@elinw thanks so much for opening this issue! I meant to reach out, but then life got crazy with work and covid homeschool, and I totally forgot. Sorry!
Your intuition is totally right. Here's a screenshot from the modelsummary website:

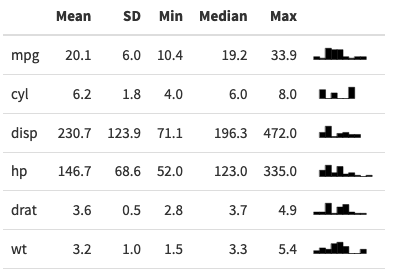
Although I did not copy your code and I figured out the unicode strategy on my own, duplicating some of the skimr functionality really came from fandom. From that perspective, I want to state at the outset that I am more than happy to make changes if you feel uncomfortable with my current approach (e.g., change the function name).
Using skimr directly sounds like a very interesting idea! Honestly, I didn't think through many of the complications, and I don't have a Windows box to test on. Right now, I expect the spark histogram to fail when:
- Output is compiled to LaTeX
- Display font does not support unicode bar characters
- Windows machines, unless users try some of the weird locale tricks you suggest on the website
Would using skimr get me any of those for "free"? Will it prevent other problems I haven't thought about?
For me, the main cost of using skimr would be to add yet another dependency (on Github, I moved ggplot2 to suggests, and am planning to further reduce my reliance on external packages). This is mainly a problem if the skimr API changes. How stable do you think the API is likely to be?
Aside from that, it doesn't look like skimr would add that many upstream dependencies:
library(miniCRAN)
mdep <- c('broom', 'checkmate', 'dplyr', 'kableExtra', 'knitr', 'magrittr', 'rmarkdown', 'tables', 'tibble', 'tidyr')
mdep <- pkgDep(mdep, suggests=FALSE)
sdep <- pkgDep("skimr", suggests=FALSE)
setdiff(sdep, mdep)
#> [1] "skimr" "repr"  "withr"
(Incidentally, when I grep the skimr repo, and I don't see any call to repr, and just a single call to withr. Does skimr need those?)
Looooongwinded way of saying: "Yes, interested! What do you think are the benefits for different output formats?"
For reference, the internal function modelsummary::factory accepts a dataframe or tibble, does some minor tranforms, and dispatches it to one of factory_* functions for each of the table-making packages. The only thing that datasummary_skim needs to do is prepare a dataframe and feed it to factory.
comment created time in 13 days
push eventvincentarelbundock/modelsummary
commit sha e74a6588916929a39f55edfea0e484e4b9c53a1d
allow align in modelsummary through ...
push time in 14 days
issue closedvincentarelbundock/modelsummary
how can I test glance_custom.glm?
The test is currently commented out because it doesn't pick up the new method in a testthat.
closed time in 15 days
vincentarelbundock
issue commentvincentarelbundock/modelsummary
how can I test glance_custom.glm?
f152e50
comment created time in 15 days
push eventvincentarelbundock/modelsummary
commit sha f152e5083e6b7e4853f168518c8b6f5001885c9d
test glance_custom
push time in 15 days
issue commentvincentarelbundock/modelsummary
great, I'll leave this open and think about it.
comment created time in 15 days
issue closedvincentarelbundock/modelsummary
better error message when wrong output type
closed time in 15 days
vincentarelbundock
issue commentvincentarelbundock/modelsummary
better error message when wrong output type
9304d55
comment created time in 15 days
push eventvincentarelbundock/modelsummary
commit sha 9304d55a68c2fd4d2b3c19576f464e948447dcf1
output sanity check
push time in 15 days
issue commentvincentarelbundock/modelsummary
The statistic or model characteristic I want (e.g., Pseudo-R2 or F) is not displayed
Cool. I will leave this Issue open because the examples in it might be relevant to other users.
comment created time in 15 days
issue openedvincentarelbundock/modelsummary
better error message when wrong output type
created time in 15 days
issue commentvincentarelbundock/modelsummary
The statistic or model characteristic I want (e.g., Pseudo-R2 or F) is not displayed
Well, here's a minimal reproducible example, using the pR2 function from the pscl package to retrieve McFadden's version of Pseudo-R2:
library(pscl)
glance_custom.glm <- function(x) data.frame(`PseudoR2` = pR2(x)["McFadden"])

mod <- glm(vs ~ drat + mpg, mtcars, family=binomial)
msummary(mod)
| Model 1 | |
|---|---|
| (Intercept) | -7.755 |
| (4.000) | |
| drat | -0.562 |
| (1.333) | |
| mpg | 0.477 |
| (0.200) | |
| Num.Obs. | 32 |
| AIC | 31.4 |
| BIC | 35.7 |
| Log.Lik. | -12.675 |
| PseudoR2 | 0.422 |
comment created time in 15 days
issue commentvincentarelbundock/modelsummary
The statistic or model characteristic I want (e.g., Pseudo-R2 or F) is not displayed
Also, when I look at the summary(model) for logitmfx, it doesn't show R2 either. So the model package's own summary function does not display it.
comment created time in 15 days
issue commentvincentarelbundock/modelsummary
What if someone uses modelsummary in a script and wants to look at the logs after running it? Then the whole log will be full of HTML...
comment created time in 15 days
issue closedvincentarelbundock/modelsummary
Is there a case to be made for coef_rename?
coef_map can already do this, but
"Coefficients that are omitted from this vector will be omitted from the table."
Sometimes, it might be convenient to just rename a single term.
Downsides:
- Additional argument to the function (I want to be very aggressive about keeping the API simple)
- Redundancy: Best to have one obvious way of doing things
closed time in 15 days
vincentarelbundock
issue commentvincentarelbundock/modelsummary
Customizing the names or format of goodness-of-fit or model characteristics
R2 is not a coefficient, it is a "goodness-of-fit" statistic. The name of those is handled by the gof_map argument. This argument expects a data.frame which includes information about the original name, the "clean" name, whether or not you want to omit the GOF statistic, and how you want to round it.
The default formatting data.frame can be found here:
modelsummary::gof_map
You can customize this data.frame or prepare a whole new one and then feed it to gof_map in order to customize the output.
To customize the output and add new information to the bottom of your table, you can either:
- Define a new
glance_custom.modelclassmethod: https://vincentarelbundock.github.io/modelsummary/articles/newmodels.html - Use the
add_rowsargument: https://vincentarelbundock.github.io/modelsummary/articles/modelsummary.html#add-rows
comment created time in 15 days
issue openedvincentarelbundock/modelsummary
Customizing the names or format of goodness-of-fit or model characteristics
@gbekes asked these questions in issue https://github.com/vincentarelbundock/modelsummary/issues/126
My issues
I wanna also change R2 to R-squared, Num.Obs to N. Not sure if gof_clean and gof_omit may work together, and how.
I'd like to change string of gof, eg se type from "HC1" to "Robust", is this possibleM
R2 is not a coefficient, it is a "goodness-of-fit" statistic. The name of those is handled by the gof_map argument. This argument expects a data.frame which includes information about the original name, the "clean" name, whether or not you want to omit the GOF statistic, and how you want to round it.
The default formatting data.frame can be found here:
modelsummary::gof_map
You can customize this data.frame or prepare a whole new one and then feed it to gof_map in order to customize the output.
To customize the output and add new information to the bottom of your table, you can either:
- Define a new
glance_custom.modelclassmethod: https://vincentarelbundock.github.io/modelsummary/articles/newmodels.html - Use the
add_rowsargument: https://vincentarelbundock.github.io/modelsummary/articles/modelsummary.html#add-rows
created time in 15 days
issue openedvincentarelbundock/modelsummary
Customizing goodness-of-fit and model characteristics
@gbekes asked these questions in issue https://github.com/vincentarelbundock/modelsummary/issues/126
My issues
I wanna also change R2 to R-squared, Num.Obs to N. Not sure if gof_clean and gof_omit may work together, and how.
I'd like to change string of gof, eg se type from "HC1" to "Robust", is this possibleM
R2 is not a coefficient, it is a "goodness-of-fit" statistic. The name of those is handled by the gof_map argument. This argument expects a data.frame which includes information about the original name, the "clean" name, whether or not you want to omit the GOF statistic, and how you want to round it.
The default formatting data.frame can be found here:
modelsummary::gof_map
You can customize this data.frame or prepare a whole new one and then feed it to gof_map in order to customize the output.
To customize the output and add new information to the bottom of your table, you can either:
- Define a new
glance_custom.modelclassmethod: https://vincentarelbundock.github.io/modelsummary/articles/newmodels.html - Use the
add_rowsargument: https://vincentarelbundock.github.io/modelsummary/articles/modelsummary.html#add-rows
created time in 15 days
issue commentvincentarelbundock/modelsummary
R2 is not a coefficient, it is a "goodness-of-fit" statistic. The name of those is handled by the gof_map argument. This argument expects a data.frame which includes information about the original name, the "clean" name, whether or not you want to omit the GOF statistic, and how you want to round it.
The default formatting data.frame can be found here:
modelsummary::gof_map
You can customize this data.frame or prepare a whole new one and then feed it to gof_map in order to customize the output.
To customize the output and add new information to the bottom of your table, you can either:
- Define a new
glance_custom.modelclassmethod.
- https://vincentarelbundock.github.io/modelsummary/articles/newmodels.html
- Use the
add_rowsargument.
- https://vincentarelbundock.github.io/modelsummary/articles/modelsummary.html#add-rows
comment created time in 15 days
issue commentvincentarelbundock/modelsummary
What if your script saves 10 tables? We just cycle through?
comment created time in 15 days
issue commentvincentarelbundock/modelsummary
Some issues when mixing ols, logit, and logitmfx
modelsummary can automatically display all the goodness-of-fit statistics produced by broom::glance. You can see what those statistics are by typing:
library(broom)
glance(model)
If the GOF statistic you want is not retrieved by glance, you may still be able to display it. The easiest way to achieve this is probably to write a glance_custom.logitmfx method. This is actually super easy; much easier than it sounds. See here for an example:
https://vincentarelbundock.github.io/modelsummary/articles/newmodels.html
BTW, not my business, but it seems quite normal to me that broom::glance would not produce R2 for logitmfx. Are you looking for "pseudo R2"?
Let's say you have a function called pseudoR2(model) which returns a single numeric value with the statistic you want. What you need to do is define this method:
library(tibble)
glance_custom.logitmfx <- function(x)  tibble(`Pseudo R2` = pseudoR2(x))
And the pseudo R2 would be added to all the logitmfx models in your table.
comment created time in 15 days