





🔒 OpenVPN server in a Docker container complete with an EasyRSA PKI CA
Production-Grade Container Scheduling and Management
WebSocket & WAMP for Python on Twisted and asyncio
Source for Google Click to Deploy solutions listed on Google Cloud Marketplace.
Kubernetes community content
serathius/cpp-project-template 0
Basic template with google test framework.
Container Runtime Interface (CRI) – a plugin interface which enables kubelet to use a wide variety of container runtimes.
Serve production static files with Django.
Pull request review commentetcd-io/etcd
scripts: add option to generate junit xml reports
function go_test { local packages="${1}" local mode="${2}" local flags_for_package_func="${3}"+ local junit_filename_prefix shift 3 local goTestFlags="" local goTestEnv=""++ ##### Create a junit-style XML test report in this directory if set. #####+ JUNIT_REPORT_DIR=${JUNIT_REPORT_DIR:-}++ # If JUNIT_REPORT_DIR is unset, and ARTIFACTS is set, then have them match.+ if [[ -z "${JUNIT_REPORT_DIR:-}" && -n "${ARTIFACTS:-}" ]]; then+ export JUNIT_REPORT_DIR="${ARTIFACTS}"+ fi++ # Used to filter verbose test output.+ go_test_grep_pattern=".*"++ if [[ -n "${JUNIT_REPORT_DIR}" ]] ; then+ goTestFlags+="-v "+ goTestFlags+="-json "+ # Show only summary lines by matching lines like "status package/test"+ go_test_grep_pattern="^[^[:space:]]\+[[:space:]]\+[^[:space:]]\+/[^[[:space:]]\+"
@ptabor The go_test_grep_pattern is to filter the go test output in the usual log/console and display only the Summary lines from json output when JUNIT Reporting is enabled.
When JUNIT Reporting is NOT enabled, the go_test_grep_pattern is ".*" thus displaying the complete output of go test.
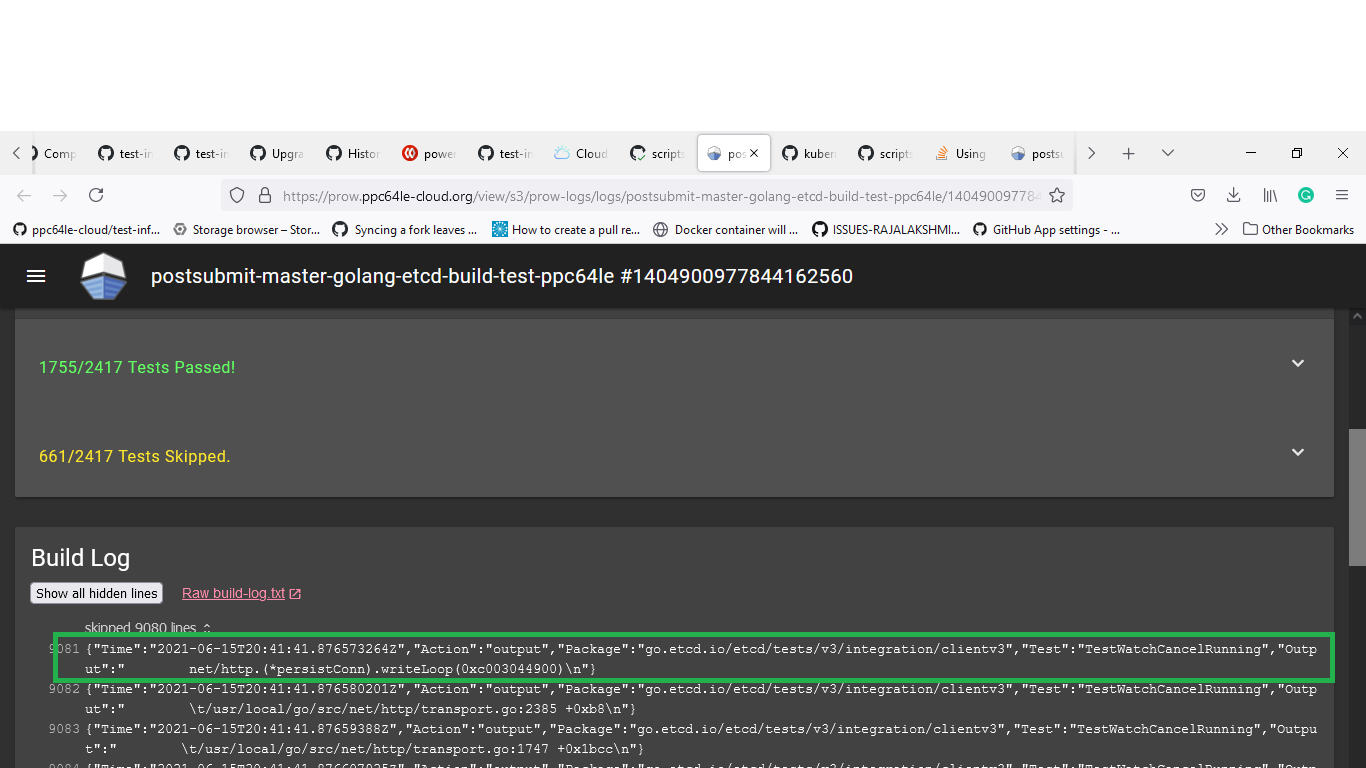
Due to this go_test_grep_pattern when JUNIT is enabled, we get below kind of output:

comment created time in an hour
Pull request review commentetcd-io/etcd
scripts: add option to generate junit xml reports
function go_test { local packages="${1}" local mode="${2}" local flags_for_package_func="${3}"+ local junit_filename_prefix shift 3 local goTestFlags="" local goTestEnv=""++ ##### Create a junit-style XML test report in this directory if set. #####+ JUNIT_REPORT_DIR=${JUNIT_REPORT_DIR:-}++ # If JUNIT_REPORT_DIR is unset, and ARTIFACTS is set, then have them match.+ if [[ -z "${JUNIT_REPORT_DIR:-}" && -n "${ARTIFACTS:-}" ]]; then+ export JUNIT_REPORT_DIR="${ARTIFACTS}"+ fi++ # Used to filter verbose test output.+ go_test_grep_pattern=".*"++ if [[ -n "${JUNIT_REPORT_DIR}" ]] ; then+ goTestFlags+="-v "+ goTestFlags+="-json "+ # Show only summary lines by matching lines like "status package/test"+ go_test_grep_pattern="^[^[:space:]]\+[[:space:]]\+[^[:space:]]\+/[^[[:space:]]\+"
Could you, please, generate a run with artificially failing test to take a look how the results (logs) from the failed test-case would look.
We have a failing test on our ppc64le architecture. Can you please tell me if the below link is accessible? https://prow.ppc64le-cloud.org/view/s3/prow-logs/logs/postsubmit-master-golang-etcd-build-test-ppc64le/1404900977844162560
comment created time in an hour
Pull request review commentetcd-io/etcd
client: log unary RPC retry failures at debug level
func (c *Client) unaryClientInterceptor(optFuncs ...retryOption) grpc.UnaryClien if lastErr == nil { return nil }- c.GetLogger().Warn(+ c.GetLogger().Debug(
Sure, updated

comment created time in 2 hours
issue openedetcd-io/etcd
etcd 3.5 health endpoint not usable when authentication is enabled
Cannot query 127.0.01:2739/health when auth enabled in version 3.5 Steps to reproduce:
❯ ./etcdctl endpoint health
127.0.0.1:2379 is healthy: successfully committed proposal: took = 6.168636ms
❯ ./etcdctl user add root:passw0rd
User root created
❯ ./etcdctl user grant-role root root
Role root is granted to user root
❯ ./etcdctl auth enable
Authentication Enabled
❯ ./etcdctl endpoint health
{"level":"warn","ts":1624550312.4325728,"logger":"client","caller":"v3/retry_interceptor.go:62","msg":"retrying of unary invoker failed","target":"etcd-endpoints://0xc00014a700/#initially=[127.0.0.1:2379]","attempt":0,"error":"rpc error: code = InvalidArgument desc = etcdserver: user name is empty"}
127.0.0.1:2379 is unhealthy: failed to commit proposal: etcdserver: user name is empty Error: unhealthy cluster
GET request to gateway doesn't give expected result

❯ etcdctl --user root:passw0rd auth disable
Authentication Disabled
❯ ./etcdctl endpoint health
127.0.0.1:2379 is healthy: successfully committed proposal: took = 2.579161ms
Expected: GET 127.0.0.1:2739/health would still work after authentication is enabled without requiring authentication.
Actual: errors giving unhealthy.
This means http GET cannot be used any more as liveness probe.
Note that:
etcdctl --user root:passw0rd endpoint health
127.0.0.1:2379 is healthy: successfully committed proposal: took = 22.706843ms
created time in 3 hours
push eventetcd-io/etcd
commit sha 501d8f01eabd9ba7a3c0a54b60420b27fdbce4bc
[release-3.4]: ClientV3: Ordering: Fix TestEndpointSwitchResolvesViolation test Signed-off-by: Sam Batschelet <[email protected]>
commit sha 41061e56ad9d654fea2ee02c851d2a74e0a8a593
Merge pull request #13139 from hexfusion/bp-12727 [release-3.4]: ClientV3: Ordering: Fix TestEndpointSwitchResolvesViolation test
push time in 4 hours
PR merged etcd-io/etcd
Manual cherry-pick of https://github.com/etcd-io/etcd/pull/12727 into release-3.4
Ran into TestEndpointSwitchResolvesViolation flakes digging through new github actions test failures.

pr closed time in 4 hours
pull request commentetcd-io/etcd
etcdutl: add command to generate shell completion
Usually, bugs are the only thing that is backported from what I can tell, but with that said I do not see an issue with users using the main branch etcdctl or etcdutl binaries with the 3.5 release.

comment created time in 5 hours
pull request commentetcd-io/etcd
etcdutl: add command to generate shell completion
Could these completion commands also be back-ported to a 3.5 release?
comment created time in 5 hours
startedkubernetes/kube-state-metrics
started time in 5 hours
Pull request review commentetcd-io/etcd
CHANGELOG: add 3.6, highlight completion commands
+++Previous change logs can be found at [CHANGELOG-3.5](https://github.com/etcd-io/etcd/blob/main/CHANGELOG-3.5.md).++<hr>++## v3.6.0 (TBD)++See [code changes](https://github.com/etcd-io/etcd/compare/v3.5.0...v3.6.0) and [v3.5 upgrade guide](https://etcd.io/docs/latest/upgrades/upgrade_3_5/) for any breaking changes.++### etcdctl v3++- Add command to generate shell completion. ([PR#13133](https://github.com/etcd-io/etcd/pull/13133)).
Nit: I believe this is more like in style to how the previous changelog was formatted, same with the other one:
- Add command to generate [shell completion](https://github.com/etcd-io/etcd/pull/13133).
comment created time in 6 hours
Pull request review commentetcd-io/etcd
CHANGELOG: add 3.6, highlight completion commands
+++Previous change logs can be found at [CHANGELOG-3.5](https://github.com/etcd-io/etcd/blob/main/CHANGELOG-3.5.md).++<hr>++## v3.6.0 (TBD)++See [code changes](https://github.com/etcd-io/etcd/compare/v3.5.0...v3.6.0) and [v3.5 upgrade guide](https://etcd.io/docs/latest/upgrades/upgrade_3_5/) for any breaking changes.
Since we don't have the upgrade guide yet for 3.6, lets skip this maybe?
comment created time in 6 hours
push eventetcd-io/etcd
commit sha df696a7e76b66de06b3411651d20615be22c7db0
go.mod: Bump etcd to 3.5.0
commit sha 5d6be34838d7c82425d9a67d9a4e564f2e341741
api/version/version.go: Fix the api version
commit sha b9d837183ad5bd186456d64c6a45d3151dde2540
server/etcdserver/api: Add 3.6 to supported version
commit sha 4e060dc12725b23a6c65636d1715830c8a0791ee
tests/e2e/ctl_v3_snapshot_test.go: Adjust version to 3.6.0
commit sha 8f9829cd2dd65479cca9b1497b6e62fdc74df2b6
Merge pull request #13114 from lilic/fix-api-version Bump etcd version to 3.5.0 and 3.6.0-pre
push time in 7 hours
PR merged etcd-io/etcd
Noticed while building etcdctl that we still reference the 3.5-alpha.0 version.
I am not sure if we want to backport this to release-3.5 branch or not. 🤔

pr closed time in 7 hours
pull request commentetcd-io/etcd
etcdutl: add command to generate shell completion
Thank you.
Could you, please, initiate the change-log: https://github.com/etcd-io/etcd/edit/main/CHANGELOG-3.5.md -> CHANGELOG-3.6.md with these changes ?
comment created time in 8 hours
PR opened etcd-io/etcd
Follow up of #13133.
I've removed the required annotation on the --data-dir flag for snapshot restore, because the completion behaves a lttle unexpected (see here) and because it is defaulted anyways.
Also changed the etcdutl defrag timeout message to link to etcdctl defrag.
pr created time in 8 hours
issue commentetcd-io/etcd
etcd-mixin: etcdExcessiveDatabaseGrowth Prometheus alert should use delta instead of increase
Sorry, I missed this issue. @lilic Thanks for the pointers, will take a shot at fixing it.

comment created time in 8 hours
push eventetcd-io/etcd
commit sha 823f85dfc9ee14df3054cf40782d5d25015041b4
etcdserver: Move version monitor logic to separate module
commit sha 72cb65233257d6f24945a1c18a79e88c7fdbff41
Merge pull request #13132 from serathius/refactor-monitor etcdserver: Move version monitor logic to separate module
push time in 10 hours
PR merged etcd-io/etcd
When working on version downgrade I noticed that logic responsible for managing versions is spread all over etcdserver module. As logic is spread around it was never tested together leading to errors like described in https://github.com/etcd-io/etcd/issues/11716#issuecomment-858668690 where cluster version monitor didn't work well with downgrade monitor.
To ensure that downgrades are well tested and working correctly we need one place to all logic together. This PR is a first step in this direction. It moves downgrade and version monitor logic to a separate module. We define an interface over etcdServer that will allow this logic to manipulate version, but also stub backend and member versions in future so we can simulate step by step upgrade process. To avoid exposing version change logic publicly I have created an adapter struct that implements the interface, but is not available outside of module.

pr closed time in 10 hours
Pull request review commentetcd-io/etcd
client: log unary RPC retry failures at debug level
func (c *Client) unaryClientInterceptor(optFuncs ...retryOption) grpc.UnaryClien if lastErr == nil { return nil }- c.GetLogger().Warn(+ c.GetLogger().Debug(
This would turn of retrying logging entirely.
How about logging it on Debug if its 1'st retry (attempt=0) and
Warning if its a consecutive retry ?
comment created time in 10 hours
issue commentetcd-io/etcd
etcd-mixin: etcdExcessiveDatabaseGrowth Prometheus alert should use delta instead of increase
Also note here, I would say we use deriv rather than delta, as delta only takes first and last sample into account. More info here https://www.robustperception.io/functions-to-avoid
comment created time in 10 hours
pull request commentkubernetes-sigs/metrics-server
Implement using /metrics/resource Kubelet endpoint -- new
@yangjunmyfm192085: Closed this PR.
<details>
In response to this:
Merged with #777. /close
Instructions for interacting with me using PR comments are available here. If you have questions or suggestions related to my behavior, please file an issue against the kubernetes/test-infra repository. </details>

comment created time in 10 hours
PR closed kubernetes-sigs/metrics-server

Signed-off-by: JunYang [email protected]
<!-- Thanks for sending a pull request! Here are some tips for you:
- If this is your first time, read our contributor guidelines https://git.k8s.io/community/contributors/guide/pull-requests.md#the-pull-request-submit-process and developer guide https://git.k8s.io/community/contributors/devel/development.md#development-guide
- If you want faster PR reviews, read how: https://git.k8s.io/community/contributors/guide/pull-requests.md#best-practices-for-faster-reviews
- Follow the instructions for writing a release note: https://git.k8s.io/community/contributors/guide/pull-requests.md#write-release-notes-if-needed
- If the PR is unfinished, see how to mark it: https://git.k8s.io/community/contributors/guide/pull-requests.md#marking-unfinished-pull-requests -->
What this PR does / why we need it:
Implement using /metrics/resource Kubelet endpoint
Which issue(s) this PR fixes (optional, in fixes #<issue number>(, fixes #<issue_number>, ...) format, will close the issue(s) when PR gets merged):
Fixes #559
pr closed time in 10 hours
pull request commentkubernetes-sigs/metrics-server
Implement using /metrics/resource Kubelet endpoint -- new
Merged with #777. /close
comment created time in 10 hours
Pull request review commentkubernetes-sigs/metrics-server
Implement using /metrics/resource Kubelet endpoint
+// Copyright 2021 The Kubernetes Authors.+//+// Licensed under the Apache License, Version 2.0 (the "License");+// you may not use this file except in compliance with the License.+// You may obtain a copy of the License at+//+// http://www.apache.org/licenses/LICENSE-2.0+//+// Unless required by applicable law or agreed to in writing, software+// distributed under the License is distributed on an "AS IS" BASIS,+// WITHOUT WARRANTIES OR CONDITIONS OF ANY KIND, either express or implied.+// See the License for the specific language governing permissions and+// limitations under the License.++package resource++import (+ "testing"+ "time"++ . "github.com/onsi/ginkgo"+ . "github.com/onsi/gomega"++ "github.com/prometheus/common/model"++ apitypes "k8s.io/apimachinery/pkg/types"+)++func TestDecode(t *testing.T) {+ RegisterFailHandler(Fail)+ RunSpecs(t, "Decode Suite")+}++var _ = Describe("Decode", func() {+ var (+ samples []*model.Sample+ )+ BeforeEach(func() {+ scrapeTime := time.Now()++ sample1 := model.Sample{Metric: model.Metric{model.MetricNameLabel: "node_cpu_usage_seconds_total"},+ Value: 100,+ Timestamp: model.Time(scrapeTime.Add(100*time.Millisecond).UnixNano() / 1e6),+ }+ sample2 := model.Sample{Metric: model.Metric{model.MetricNameLabel: "node_memory_working_set_bytes"},+ Value: 200,+ Timestamp: model.Time(scrapeTime.Add(100*time.Millisecond).UnixNano() / 1e6),+ }+ sample3 := model.Sample{Metric: model.Metric{model.MetricNameLabel: "container_cpu_usage_seconds_total", "container": "container1", "namespace": "ns1", "pod": "pod1"},+ Value: 300,+ Timestamp: model.Time(scrapeTime.Add(10*time.Millisecond).Unix() / 1e6),+ }+ sample4 := model.Sample{Metric: model.Metric{model.MetricNameLabel: "container_memory_working_set_bytes", "container": "container1", "namespace": "ns1", "pod": "pod1"},+ Value: 400,+ Timestamp: model.Time(scrapeTime.Add(10*time.Millisecond).Unix() / 1e6),+ }+ sample5 := model.Sample{Metric: model.Metric{model.MetricNameLabel: "container_cpu_usage_seconds_total", "container": "container2", "namespace": "ns1", "pod": "pod1"},+ Value: 500,+ Timestamp: model.Time(scrapeTime.Add(20*time.Millisecond).Unix() / 1e6),+ }+ sample6 := model.Sample{Metric: model.Metric{model.MetricNameLabel: "container_memory_working_set_bytes", "container": "container2", "namespace": "ns1", "pod": "pod1"},+ Value: 600,+ Timestamp: model.Time(scrapeTime.Add(20*time.Millisecond).Unix() / 1e6),+ }+ sample7 := model.Sample{Metric: model.Metric{model.MetricNameLabel: "container_cpu_usage_seconds_total", "container": "container1", "namespace": "ns1", "pod": "pod2"},+ Value: 700,+ Timestamp: model.Time(scrapeTime.Add(30*time.Millisecond).Unix() / 1e6),+ }+ sample8 := model.Sample{Metric: model.Metric{model.MetricNameLabel: "container_memory_working_set_bytes", "container": "container1", "namespace": "ns1", "pod": "pod2"},+ Value: 800,+ Timestamp: model.Time(scrapeTime.Add(30*time.Millisecond).Unix() / 1e6),+ }+ sample9 := model.Sample{Metric: model.Metric{model.MetricNameLabel: "container_cpu_usage_seconds_total", "container": "container1", "namespace": "ns2", "pod": "pod1"},+ Value: 900,+ Timestamp: model.Time(scrapeTime.Add(40*time.Millisecond).Unix() / 1e6),+ }+ sample10 := model.Sample{Metric: model.Metric{model.MetricNameLabel: "container_memory_working_set_bytes", "container": "container1", "namespace": "ns2", "pod": "pod1"},+ Value: 1000,+ Timestamp: model.Time(scrapeTime.Add(40*time.Millisecond).Unix() / 1e6),+ }+ sample11 := model.Sample{Metric: model.Metric{model.MetricNameLabel: "container_cpu_usage_seconds_total", "container": "container1", "namespace": "ns3", "pod": "pod1"},+ Value: 1100,+ Timestamp: model.Time(scrapeTime.Add(50*time.Millisecond).Unix() / 1e6),+ }+ sample12 := model.Sample{Metric: model.Metric{model.MetricNameLabel: "container_memory_working_set_bytes", "container": "container1", "namespace": "ns3", "pod": "pod1"},+ Value: 1200,+ Timestamp: model.Time(scrapeTime.Add(50*time.Millisecond).Unix() / 1e6),+ }+ samples = []*model.Sample{}+ samples = append(samples, &sample1, &sample2, &sample3, &sample4, &sample5, &sample6, &sample7, &sample8, &sample9, &sample10, &sample11, &sample12)+ })++ It("should use the decode time from the CPU", func() {+ By("removing some times from the data")++ By("decoding")+ batch := decodeBatch(samples, "node1")++ By("verifying that the scrape time is as expected")+ Expect(batch.Nodes["node1"].Timestamp).To(Equal(time.Unix(0, int64(samples[0].Timestamp*1e6))))+ Expect(batch.Pods[apitypes.NamespacedName{Namespace: "ns1", Name: "pod1"}].Containers["container1"].Timestamp).To(Equal(time.Unix(0, int64(samples[2].Timestamp*1e6))))+ Expect(batch.Pods[apitypes.NamespacedName{Namespace: "ns1", Name: "pod2"}].Containers["container1"].Timestamp).To(Equal(time.Unix(0, int64(samples[6].Timestamp*1e6))))+ })++ It("should continue on missing CPU or memory metrics", func() {+ By("removing some data from the raw samples")+ samples[1].Timestamp = 0+ samples[1].Value = 0+ samples[4].Timestamp = 0+ samples[4].Value = 0+ samples[6].Value = 0+ samples[9].Timestamp = 0+ samples[9].Value = 0+ samples[11].Value = 0++ By("decoding")+ batch := decodeBatch(samples, "node1")++ By("verifying that the batch has all the data, save for what was missing")+ Expect(batch.Pods).To(HaveLen(0))+ Expect(batch.Nodes).To(HaveLen(0))+ })++ It("should skip on cumulative CPU equal zero", func() {
@serathius, I have fixed it.
comment created time in 11 hours
push eventetcd-io/etcd
commit sha 6eabc41aee3cc31426ab9e91ef77f960dcd11832
etcdctl: add command to generate shell completion To improve the UX of etcdctl. Completion is generated by cobra according to defined commands and flags. Fixes #13111
commit sha 96b8049d815042d391de74ecdb1029bf0a727386
Write test for for bash completion
commit sha 69fadd41b0732f23278daff78166cad20108bfec
Merge pull request #13133 from avorima/shell-completion etcdctl: add command to generate shell completion
push time in 11 hours
PR merged etcd-io/etcd
To improve the UX of etcdctl. Completion is generated by cobra according to defined commands and flags.
Fixes #13111
pr closed time in 11 hours
issue closedetcd-io/etcd
etcdctl: Provide shell completion
It would be nice to have shell completion for etcdctl. Many projects do this, either by generating some shell code or handling in the code. Also, cobra support completion OOTB, but the current version in the 3.4 release branch is too low.
https://github.com/spf13/cobra/blob/master/shell_completions.md
closed time in 11 hours
avorima
issue commentetcd-io/etcd
Etcd performance is not good enough.
I would expect 2. be addressed in 3.5 as part of this issue: https://github.com/etcd-io/etcd/issues/12680

comment created time in 11 hours