








DefCon 26 Badge Hacking
Subcommand helpers for github.com/urfave/cli
Run go programs as a service on major platforms.
firelizzard18/adam_blaire_portfolio 0
My portfolio
Automatically exported from code.google.com/p/airmac
firelizzard18/airstream-media-player 0
Automatically exported from code.google.com/p/airstream-media-player
firelizzard18/Arduino-LCD-Screen 0
Library for displaying characters on a Nokia 5110
firelizzard18/Arduino-Touch-Pad 0
Arduino library for a resistive touch pad such as the Nintendo DS (https://www.sparkfun.com/products/8977)
Google Two-Step Authenticator for Pebble
Debugging in Ruby 2
push eventfirelizzard18/byebug
commit sha fdc84e22ab071258944731d45b8468ea25a6f820
Command to set hit conditions
push time in 17 hours
push eventfirelizzard18/byebug
commit sha e2039edc2406b0ae8833e7caa24e156dc353d2a9
Command to set hit conditions
push time in 17 hours
PR opened deivid-rodriguez/byebug
@deivid-rodriguez I put together a way to set hit conditions via the CLI, per our discussion https://github.com/deivid-rodriguez/byebug/pull/747#issuecomment-708662824.
Doing it all in one command with a single regex and a single help string was getting messy, so I split ConditionCommand into subcommands.
pr created time in 17 hours
pull request commentdeivid-rodriguez/byebug
Allow Breakpoint#hit_condition=(nil)
Any ideas on how to better expose it?
ConditionCommand could be modified to support hit conditions. Possibly:
cond[ition] [expr[ession]] <n>[ expr]cond[ition] hit[count] <n>[ <op> value]
Implemented as:

comment created time in 7 days
push eventfirelizzard18/byebug
commit sha 7275ff766a1869fa38520fd957e3b39abfa7be87
Allow Breakpoint#hit_condition=(nil)
push time in 8 days
PR opened deivid-rodriguez/byebug
Closes #739.
This MR modifies brkpt_set_hit_condition in ext/byebug/breakpoint.c to allow clearing a breakpoint's hit condition by setting it to nil. The documentation on the function indicates this should be possible, but passing nil will raise an exception, and no code path in the function will set the condition to HIT_COND_NONE.
pr created time in 8 days
PR opened deivid-rodriguez/byebug
Replacing Document-class: Byebug with Document-module: Byebug in ext/byebug/byebug.c fixes yard doc. Without this, it appears that YARD clobbers everything except what's in the C files. At the time of writing, https://rubydoc.info/gems/byebug contains only the following:
- Byebug (module)
- DebugThread < Thread
- ThreadsTable < Object
- Context < Object
- Exception
- Kernel
- ThreadsTable < Object
This is missing almost all the Ruby classes. This change un-confuses YARD, resulting in documentation for the Ruby code.
pr created time in 8 days
issue openeddeivid-rodriguez/byebug
Hit condition cannot be set to nil despite documentation
Problem description
The documentation on Breakpoint#hit_condition= indicates that nil should be a valid value. However, the implementation doesn't actually handle nil.
https://github.com/deivid-rodriguez/byebug/blob/c27c0c74c67743d20d6ceae58fe242118545dc50/ext/byebug/breakpoint.c#L114-L142
Expected behavior
Calling bp.hit_condition=(nil) sets breakpoint->hit_condition = HIT_COND_NONE;
Actual behavior
TypeError (nil is not a symbol)
Steps to reproduce the problem
irb> require 'byebug/core'
irb> bp = Byebug::Breakpoint.add('file.rb', 1)
irb> bp.hit_condition = nil
created time in 8 days
PR opened microsoft/debug-adapter-protocol
- Adapter extension - VSCode Byebug Debugger (repo)
- Adapter -
byebug-dapGem (repo) - SDK -
ruby-dapGem (repo)
pr created time in 9 days
push eventfirelizzard18/debug-adapter-protocol
commit sha 3db5049721786d5466b0f39271bb5173fd339b17
Add byebug-dap and ruby-dap
push time in 9 days
issue openeddeivid-rodriguez/byebug
Differentiate between class and instance methods
Problem description
I want to be able to set a function breakpoint on Foo.method(:bar) separately from Foo.instance_method(:bar). I don't have any strong feelings about how/if this is handled by byebug's frontend/interface, because I am implementing my own interface. For that, I just need some way to create a breakpoint that is instance-only or class/module-only.
class Foo
  def bar
    # ...
  end

  def self.bar
    # ...
  end
end
Expected behavior
When I set a breakpoint on Foo#bar, byebug breaks on the instance method. When I set a breakpoint on Foo.bar, byebug breaks on class method.
Actual behavior
When I set a breakpoint, I cannot specify instance vs class, I can only specify the class name and method name. Because of this and because Byebug's method breakpoint handling is agnostic of instance vs class method, byebug breaks on both methods when I set a method breakpoint.
Steps to reproduce the problem
- Include the above class and
loop { Foo.new.bar; Foo.bar }intest.rb - Debug
test.rbwith byebug - Set a method breakpoint with
Foo#barorFoo.bar - Byebug breaks on both the instance and class method, regardless of how the breakpoint is created
created time in 11 days
issue commentmicrosoft/vscode
Detaching from a parent debugging session leaves a zombie child session
In this case, a long-running process with worker process children is running. When VSCode attaches to the main process, the debug adapter informs the extension of the children (via a custom event), and VSCode attaches to the children, as child debug sessions. When VSCode disconnects from a given session, the process/debug adapter (intentionally) does not exit.
This appears to be a side-effect of the fact that VSCode leaves the Call Stack view empty if there is only a single debug session, which is single threaded. If I start a second thread in the child, the two threads appear in the Call Stack view. I still find this behavior confusing, but I guess it's not a bug. I might open a feature request: "VSCode should show something in the Call Stack view for a single, single-threaded debug session."
comment created time in 13 days
issue commentmicrosoft/vscode
Provide a way to specify controlling debug session in multi-session scenarios
Fun fact - disconnecting from the parent session does not disconnect from the child session, but it does remove both sessions from the Call Stack view, unless the child is paused, and the toolbar remains up and associated with the child session: #108351

comment created time in 13 days
issue openedmicrosoft/vscode
Detaching from a parent debugging session leaves a zombie child session
Issue Type: <b>Bug</b>
VS Code version: Code 1.49.3 (2af051012b66169dde0c4dfae3f5ef48f787ff69, 2020-10-02T17:54:06.165Z) OS version: Darwin x64 19.6.0
- Attach to or launch a debugger that spawns a child process and attaches to the child as a nested debugger session
- Detach from the parent session
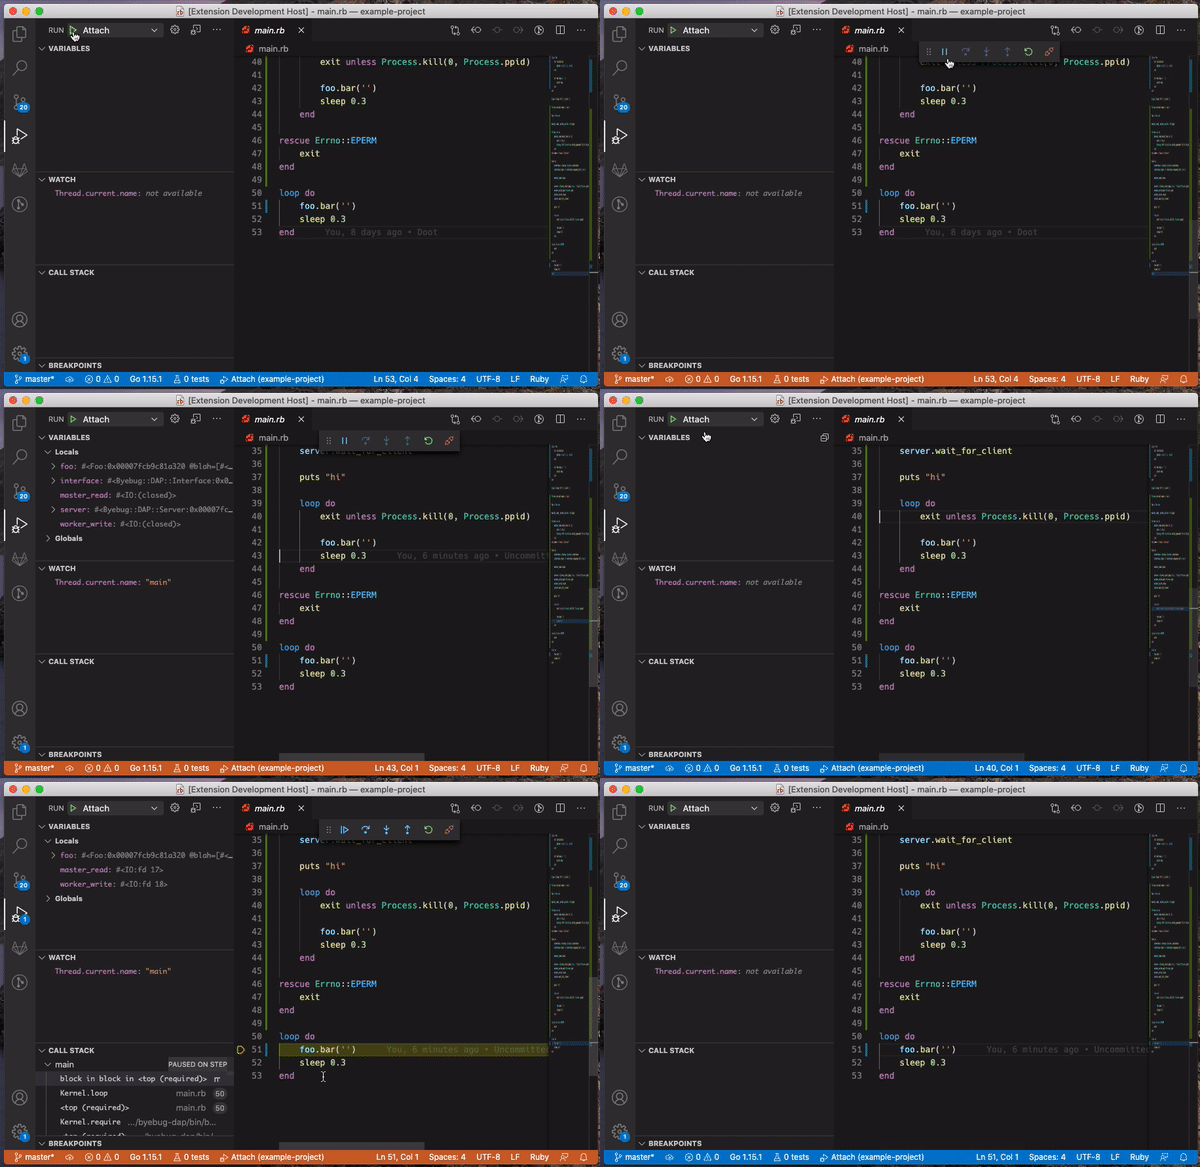
- The child session stays attached and the debugger toolbar stays active, but the child session disappears from the call stack pane.
I am using vscode-byebug and byebug-dap. I've attached my test ruby file and launch configurations. For attaching, I am running bundle exec byebug-dap -f --wait --unix debug.socket main.rb.
<details> <summary>System Info</summary>
| Item | Value |
|---|---|
| CPUs | Intel(R) Core(TM) i7-6700HQ CPU @ 2.60GHz (8 x 2600) |
| GPU Status | 2d_canvas: enabled<br>flash_3d: enabled<br>flash_stage3d: enabled<br>flash_stage3d_baseline: enabled<br>gpu_compositing: enabled<br>metal: disabled_off<br>multiple_raster_threads: enabled_on<br>oop_rasterization: enabled<br>opengl: enabled_on<br>protected_video_decode: unavailable_off<br>rasterization: enabled<br>skia_renderer: disabled_off_ok<br>video_decode: enabled<br>webgl: enabled<br>webgl2: enabled |
| Load (avg) | 2, 2, 2 |
| Memory (System) | 16.00GB (0.46GB free) |
| Process Argv | --crash-reporter-id b66d31ed-6df8-483a-9367-cc739cc188f5 |
| Screen Reader | no |
| VM | 0% |
</details><details><summary>Extensions (33)</summary>
| Extension | Author (truncated) | Version |
|---|---|---|
| calculate | aca | 2.1.0 |
| Bookmarks | ale | 11.3.1 |
| quitcontrol-vscode | art | 3.1.3 |
| rails | bun | 0.16.7 |
| vscode-gemfile | bun | 0.4.0 |
| better-toml | bun | 0.3.2 |
| vscode-test-explorer-status-bar | con | 1.1.2 |
| vscode-eslint | dba | 2.1.8 |
| gitlens | eam | 10.2.2 |
| permute-lines | ear | 1.1.0 |
| EditorConfig | Edi | 0.15.1 |
| vscode-npm-script | eg2 | 0.3.13 |
| vscode-byebug | eth | 0.1.0 |
| vscode-go-test-adapter | eth | 0.1.3 |
| vscode-firefox-debug | fir | 2.9.1 |
| gitlab-workflow | Git | 3.3.0 |
| go | gol | 0.17.2 |
| vscode-graphql | Gra | 0.3.10 |
| vscode-test-explorer | hbe | 2.19.1 |
| docomment | k-- | 0.1.18 |
| cpptools | ms- | 1.0.1 |
| hexeditor | ms- | 1.3.0 |
| vsliveshare | ms- | 1.0.2902 |
| vsliveshare-audio | ms- | 0.1.91 |
| vsliveshare-pack | ms- | 0.4.0 |
| debugger-for-chrome | msj | 4.12.11 |
| material-icon-theme | PKi | 4.3.0 |
| ruby | reb | 0.27.0 |
| slim | sia | 0.1.2 |
| rewrap | stk | 1.13.0 |
| code-spell-checker | str | 1.9.2 |
| haml | vay | 1.0.1 |
| vscode-ruby | win | 0.27.0 |
</details> <!-- generated by issue reporter -->
created time in 13 days
issue commentmicrosoft/vscode
Expose output from executable debug adapter
@weinand My use case is https://gitlab.com/firelizzard/vscode-byebug, specifically ByebugAdapterDescriptorFactory. ExecutableDebugAdapter is perfect for my purposes:
- I have a debug adapter (written in Ruby, for Ruby programs) that fully supports DAP, and thus the extension doesn't need to implement anything except startup.
- The DA supports stdin/stdout communications, which is ideal because I don't need to pollute user systems with unnecessary sockets.
ExecutableDebugAdapterhandles all of this, except failures.
The last point is especially problematic, because I don't have access to ExecutableDebugAdapter (and I'm not likely to get it: #108138) - all I can do is return a DebugAdapterExecutable.
If everything goes well, I return a DebugAdapterExecutable that launches byebug-dap --wait --stdio <program> <args> (or bundle exec byebug-dap <...>), and everything works perfectly. However, DebugAdapterExecutable does nothing to capture stderr. If the program argument is invalid, the debugger tracker will see ENOENT and a path, which is useful. But if bundle exists but it can't find byebug-dap, all I get is "exited with code 127", and zero information.
Beyond that, sometimes my extension has bugs (e.g. passing the wrong options) or the DA has bugs, and I want to show that error output somewhere. But DebugAdapterExecutable doesn't capture it at all.
I suppose a workable middleground would DebugAdapterStdio/StdioDebugAdapter, but I'd rather leave the child process handling to ExecutableDebugAdapter.
comment created time in 13 days
issue openedmicrosoft/vscode
AbstractDebugAdapter.onMessage checks for existing eventCallback instead of messageCallback
I believe there's a typo in AbstractDebugAdapter:
https://github.com/microsoft/vscode/blob/6bebcbb58d95e59ffde0e372888c5eea3995bf82/src/vs/workbench/contrib/debug/common/abstractDebugAdapter.ts#L43-L48
I'm pretty sure that should be if (this.messageCallback), not if (this.eventCallback)
created time in 13 days
issue commentmicrosoft/vscode
Expose debug adapters to extensions
This does not work for me.
I have a debug adapter that can work via stdin/stdout or via a unix socket:
class MyFactory implements DebugAdapterDescriptorFactory {
    async createDebugAdapterDescriptor(session: DebugSession) {
        if (session.configuration.request == 'attach') {
            return new DebugAdapterNamedPipeServer(session.configuration.socket);
        }

        const program = '...'
        const args = ['...', '--listen-on-unix-socket', '/tmp/byebug.socket']
        const dbg = spawn(program, args, {
            cwd: config.cwd,
            env: config.env,
            stdio: 'pipe',
        });

        let ready: (r: Boolean) => void;
        const setup = new Promise((ready) => {
            dbg.stdout.on('data', /* ... */);
            dbg.stderr.on('data', /* ... */);
            dbg.on('exit', /* ... */);
            dbg.on('error', /* ... */);
        });

        if (!await setup)
            return null;

        return new DebugAdapterNamedPipeServer('/tmp/byebug.socket');
    }
}
However, if I instruct my adapter to listen on stdin/stdout and use ProtocolServer:
        const args = ['...', '--listen-on-unix-stdio']
        // ...

        const adapter = new ProtocolServer();
        adapter.start(dbg.stdout, dbg.stdin);
        return new DebugAdapterInlineImplementation(adapter);
Then it does not work. The debug session hangs, with only the restart and stop buttons enabled and the progress indicator cycling endlessly. I put a breakpoint on the return statement, and it does return.
comment created time in 14 days
issue commentmicrosoft/vscode
Expose output from executable debug adapter
The existence of DebugAdapterExecutable in index.d.ts implies that extensions should be able to use it. I think it is reasonable to expect to act on output from the executable spawned by returning a DebugAdapterExecutable, so I created an MR to enable that. The MR template indicated that every MR is required to have a corresponding issue, so I created one.
comment created time in 14 days
PR opened microsoft/vscode
This PR fixes #108145:
- Adds
onOutput: Event<string>toAbstractDebugAdapter(and thus to all debug adapter classes) - Adds
onOutput?(output: string): voidtoDebugAdapterTrackerandMultiTracker - Adds
$acceptDAOutput(handle: number, output: string): voidtoMainThreadDebugServiceShapeandMainThreadDebugService - Modifies
ExecutableDebugAdapter.startSessionto forward the child process' stderr toonOutput - Modifies
ExtHostDebugServiceBase.$startDASessionto forward the debug adapter'sonOutputtotracker.onOutputand todebugServiceProxy.$acceptDAOutput
This can be tested by adding onOutput(s: string): void to a debug adapter tracker that tracks a debug adapter that uses DebugAdapterExecutable/ExecutableDebugAdapter to spawn a process that outputs on stderr.
pr created time in 16 days
issue openedmicrosoft/vscode
Expose output from executable debug adapter
<!-- ⚠️⚠️ Do Not Delete This! feature_request_template ⚠️⚠️ --> <!-- Please read our Rules of Conduct: https://opensource.microsoft.com/codeofconduct/ --> <!-- Please search existing issues to avoid creating duplicates. -->
<!-- Describe the feature you'd like. -->
When I return a DebugAdapterExecutable from DebugAdapterDescriptorFactory.createDebugAdapterDescriptor, the debug adapter that VSCode creates (ExecutableDebugAdapter) spawns a child process, but does not expose stderr of that process in any way.
VSCode should provide a way for extensions to act on stderr of the process spawned by ExecutableDebugAdapter.
This is somewhat related to #98976.
created time in 16 days
issue commentmicrosoft/vscode
Expose debug adapters to extensions
@connor4312 Nothing in that project fills the role of ExecutableDebugAdapter, so I would still have to reimplement most of its functionality. ExecutableDebugAdapter does exactly what I want, which is why I am asking for it to be exposed.
comment created time in 16 days
issue openedmicrosoft/vscode
Expose debug adapters to extensions
<!-- ⚠️⚠️ Do Not Delete This! feature_request_template ⚠️⚠️ --> <!-- Please read our Rules of Conduct: https://opensource.microsoft.com/codeofconduct/ --> <!-- Please search existing issues to avoid creating duplicates. -->
I request that the classes in the following files are exposed to extensions, or distributed as a separate NPM package:
src/vs/workbench/contrib/debug/common/abstractDebugAdapter.tsAbstractDebugAdapter
src/vs/workbench/contrib/debug/node/debugAdapter.tsStreamDebugAdapterNetworkDebugAdapterSocketDebugAdapterNamedPipeDebugAdapterExecutableDebugAdapter
As an extension developer, when implementing a DebugAdapterDescriptorFactory, I have access to a number of descriptors I can return: DebugAdapterExecutable, DebugAdapterServer, and DebugAdapterNamedPipeServer. However, I do not have access to the actual debug adapter implementation that is instantiated, unless I write and instantiate my own adapter and return a DebugAdapterInlineImplementation. Thus, if I want to provide any variation on the base executable, server, or named pipe server debug adapter implementations, I am forced to reimplement the entire adapter.
This is very inconvenient, as I am working on a debugger extension for a Ruby debug adapter that has first-class support for DAP. The existing ExecutableDebugAdapter does 99% of what I need; all it's missing is a way to handle STDERR:
class MyDebugAdapter extends ExecutableDebugAdapter {
    async startSession(): Promise<void> {
        await super.startSession()

        this.serverProcess.stderr!.on('data', data => /* do something useful */);
    }
}
created time in 16 days
pull request commentmicrosoft/vscode
Add a confirmBeforeQuit setting
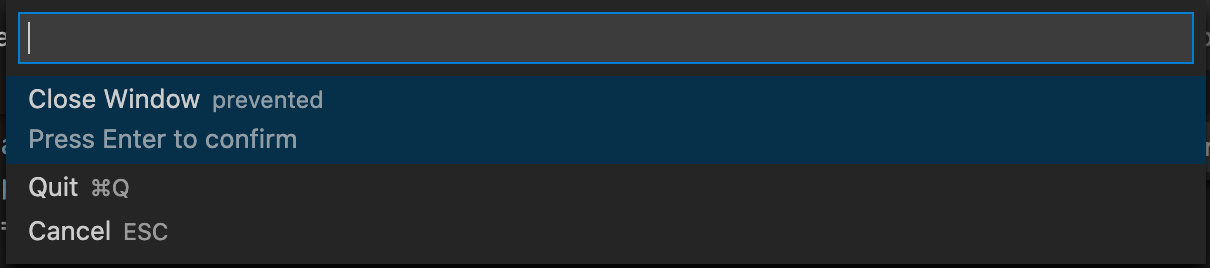
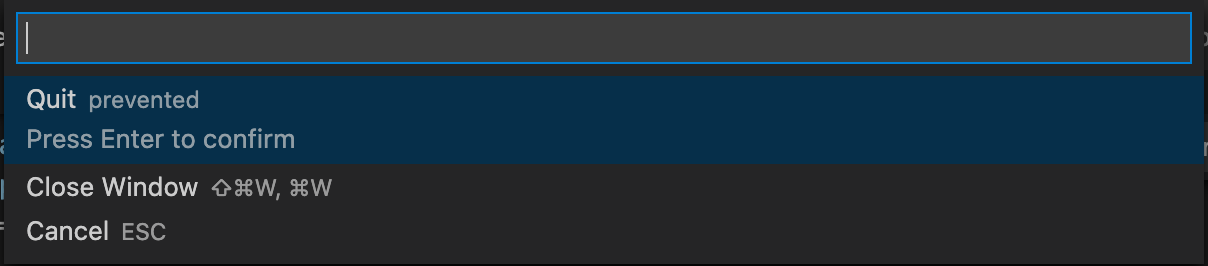
@bpasero @SneakyFish5 I prefer the way Quit Control does it. If you quit, it asks "Do you really want to quit?". If you close a window, it asks "Do you really want to close this window?" Though system modal dialogs (as in this PR) may be better than VSCode-style prompts, because they're more in-your-face, which seems appropriate for this feature.
Note that this could still be compatible with the keybinding suggestion in #14710: Meta-Q once brings up the confirmation, Meta-Q a second time confirms. So Meta-Q, Enter and Meta-Q, Meta-Q would both quit/exit.
I think the second option that Quit Control shows should be omitted. It seems like it's saying, "Did you mean to Quit? If you actually meant to close, use Meta-W or Meta-Shift-W." I doubt that is a frequent point of confusion. When I accidentally quit, it's because I was aiming for Alt+Q (rewrap) but hit Meta+Q. When I accidentally close, it's because I was spamming Meta+W to close tabs and went too far.

comment created time in 17 days
fork firelizzard18/debug-adapter-protocol
Defines a common protocol for debug adapters.
https://microsoft.github.io/debug-adapter-protocol/
fork in 18 days
issue commentrubyide/vscode-ruby
Feature request: Attaching debugger to existing process
@wingrunr21 This is still an issue. Please fix it. It's a really simple change:
diff --git a/packages/vscode-ruby-debugger/src/main.ts b/packages/vscode-ruby-debugger/src/main.ts
index bd3ec94..e859e13 100644
--- a/packages/vscode-ruby-debugger/src/main.ts
+++ b/packages/vscode-ruby-debugger/src/main.ts
@@ -508,7 +508,11 @@ class RubyDebugSession extends DebugSession {

     protected disconnectRequest(response: DebugProtocol.DisconnectResponse, args: DebugProtocol.DisconnectArguments) {
         if (this.rubyProcess.state !== SocketClientState.closed) {
-            this.rubyProcess.Run('quit');
+            if (this.debugMode === Mode.launch) {
+                this.rubyProcess.Run('quit');
+            } else {
+                this.rubyProcess.Run('detach');
+            }
         }
         this.sendResponse(response);
     }

comment created time in 23 days
pull request commentmicrosoft/vscode
Add a confirmBeforeQuit setting
I would much rather "Do you really want to quit?" behavior over making Cmd/Ctrl+Q chorded as in https://github.com/microsoft/vscode/issues/14710#issuecomment-488114446.
comment created time in 23 days
issue commentmicrosoft/vscode
Users asking for features is how VSCode improves, and maybe if enough people ask for this feature, it will actually happen. But complaining is pointless.

comment created time in a month
issue commentmicrosoft/vscode
Really struggling to see why.
Because it's not a priority for them. As a team, they have decided to prioritize other things. You can disagree with their decisions, but all of this "OMG whhhhhy" whining is obnoxious and pointless.
comment created time in a month