








valyala/fasthttp 13464
Fast HTTP package for Go. Tuned for high performance. Zero memory allocations in hot paths. Up to 10x faster than net/http
valyala/fastjson 1023
Fast JSON parser and validator for Go. No custom structs, no code generation, no reflection
valyala/gorpc 613
Simple, fast and scalable golang rpc library for high load
Simple and fast template engine for Go
Anti-memory-waste byte buffer pool
valyala/goloris 266
Slowloris for nginx DoS. Written in go
valyala/gozstd 248
go wrapper for zstd
valyala/fastrand 107
Fast and scalable pseudorandom generator for Go
valyala/gheap 101
Fast generalized heap tree algorithms in C++ and C. Provides simultaneous support for D-heap and B-heap.
Building blocks for fast rpc systems
push eventVictoriaMetrics/VictoriaMetrics
commit sha ffa6581c46e9e7b6d181f8501ca4bdf568e34671
app/vminsert: refresh the list of healthy storage nodes only if the the row cannot be sent to destination storage node Previously the list had been generated for each rerouted row. This could consume additional CPU time during rerouting, which could lead to rerouting slowdown. Updates https://github.com/VictoriaMetrics/VictoriaMetrics/issues/791
push time in 2 minutes
issue commentVictoriaMetrics/VictoriaMetrics
Running gmake victoria-metrics-pure on BSD failed from release source
use the vendor/golang.org/x/sys at the release version or (probably better) use the OS release version DISTNAME = go-sys-20190904 ? which is the go-sys package in OpenBSD
I'm unsure that using OS release version of golang.org/x/sys or other third-party Go packages is better than using vendored packages from vendor folder. This requires setting up thrid-party dependencies before building VictoriaMetrics. Currently VictoriaMetrics can be built without the need to configure any third-party dependencies except of Go itself. It would be better upstreaming OpenBSD-related changes to from OS release versions to golang.org/x/sys, so they can be incorporated into vendor directory with make vendor-update command.
FYI, support for OpenBSD has been added in the following commits:
- single-node version - cc90a548b1822f536988cf4cfc3f4f52c34afcf5
- cluster version - 658a05ef0f6d93ab00b68194ee3e71e134caa776
The following line must be used for building VictoriaMetrics binary for OpenBSD: GOOS=openbsd gmake victoria-metrics-pure, as @GhioRodolphe mentioned above. victoria-metrics-pure can be substituted with vmagent-pure, vmalert-pure, etc. for building other vm* binaries.
These commits will be included in the next release.

comment created time in 26 minutes
push eventVictoriaMetrics/VictoriaMetrics
commit sha 658a05ef0f6d93ab00b68194ee3e71e134caa776
added openbsd implementations (#790) https://github.com/VictoriaMetrics/VictoriaMetrics/issues/785 removed fadvise for openbsd, added freespace implemenation for openbsd
commit sha 81cdf2fa1437008b5ebb01bd2945d8993fcfea69
lib/{fs,filestream}: small consistency-related updates after cc90a548b1822f536988cf4cfc3f4f52c34afcf5
commit sha f68bf12a84430da480867bd0f671d029413562cd
.github/workflows: verify that VictoriaMetrics can be built for GOOS=openbsd
commit sha 1e7452e50163379d711f83ad1934b3721e0cba1b
.github/workflows: verify builds for vmagent, vmalert, vmbackup and vmrestore
push time in 41 minutes
push eventVictoriaMetrics/VictoriaMetrics
commit sha 76738392282b6b1d032fd91e17d19970770dcb07
lib/{fs,filestream}: small consistency-related updates after cc90a548b1822f536988cf4cfc3f4f52c34afcf5
commit sha 41f24cdb647476b6b9af54e86ace14ae8c9699b5
.github/workflows: verify that VictoriaMetrics can be built for GOOS=openbsd
commit sha 165c9c6371af349a9ca0483195f0afb6b004795e
.github/workflows: verify builds for vmagent, vmalert, vmbackup and vmrestore
push time in 42 minutes
push eventVictoriaMetrics/VictoriaMetrics
commit sha cc90a548b1822f536988cf4cfc3f4f52c34afcf5
added openbsd implementations (#790) https://github.com/VictoriaMetrics/VictoriaMetrics/issues/785 removed fadvise for openbsd, added freespace implemenation for openbsd
push time in an hour
PR merged VictoriaMetrics/VictoriaMetrics
https://github.com/VictoriaMetrics/VictoriaMetrics/issues/785
removed fadvise for openbsd, added freespace implemenation for openbsd

pr closed time in an hour
push eventVictoriaMetrics/VictoriaMetrics
commit sha 3f811825170b65a59a8fc34a0d4e9a86635193a7
Apply suggestions from code review Co-authored-by: Roman Khavronenko <[email protected]>
push time in an hour
push eventVictoriaMetrics/VictoriaMetrics
commit sha bc37f1cbec33a5d9f736a5ba9ccccabd24835034
app/vminsert: do not pollute logs with repated `cannot dial storageNode` errors Log only the first error per -storageNode
push time in an hour
push eventVictoriaMetrics/VictoriaMetrics
commit sha 8d5df13c7c3e9d029ea5273b291d44bb1e6c7258
vendor: `make vendor-update`
push time in 4 hours
push eventVictoriaMetrics/VictoriaMetrics
commit sha 0548f0c5c8278c5f424145a315f00dfa3fc330b0
vendor: `make vendor-update`
push time in 4 hours
push eventVictoriaMetrics/VictoriaMetrics
commit sha 750014632122add173ee250df811b11b92085464
lib/protoparser: avoid copying of buffer read from the network to unmarshal buffer
push time in 4 hours
push eventVictoriaMetrics/VictoriaMetrics
commit sha 1481d6d8ffbb67a147113048ad15a6d0556a6e6e
lib/protoparser: avoid copying of buffer read from the network to unmarshal buffer
commit sha 9d123eb22a12ae544fd4297e7db0ac3fba88abe2
app/vminsert: remove useless delays when sending data to vmstorage This improves the maximum data ingestion performance for cluster VictoriaMetrics Updates https://github.com/VictoriaMetrics/VictoriaMetrics/issues/791
commit sha 2ee0dc27a6af02bc139c8ba81bd9bd71175a1423
app/vmstorage: parallelize data processing obtained from a single connection from vminsert Previously vmstorage could use only a single CPU core for data processing from a single connection from vminsert. Now all the CPU cores can be used for data processing from a single connection from vminsert. This should improve the maximum data ingestion performance for a single vminsert->vmstorage connection.
push time in 4 hours
push eventVictoriaMetrics/VictoriaMetrics
commit sha 533bf76a1292f07ad36dcd1a7d9a87194ce38ab2
lib/storage: correctly use maxBlockSize in various checks Previously `maxBlockSize` has been multiplied by 8 in certain checks. This is unnecessary.
commit sha 973df0968647e84774847e63855cc403715c19e9
app/vmselect/netstorage: do not spend CPU time on unpacking empty blocks during `/api/v1/series` calls
commit sha 8fc9b77496aac742b54fc02abee778ca1054f646
app/vmagent: reduce memory usage when importing data via /api/v1/import Previously vmagent could use big amounts of RAM when each ingested JSON line contained many samples.
commit sha e83947a882527cacf0045eca8071e4eb344227f9
app/vminsert: code prettifying
commit sha 00ec2b71892e7ce6a0598f7c5b7d98ebd1cf05b6
lib/protoparser: use all the available CPU cores for processing ingested data from a single /api/v1/import stream Previously a single data ingestion stream to /api/v1/import could load only a single CPU core.
commit sha aadbd014ff9f4e53763fa287311f1caa370feece
all: add native format for data export and import The data can be exported via [/api/v1/export/native](https://victoriametrics.github.io/#how-to-export-data-in-native-format) handler and imported via [/api/v1/import/native](https://victoriametrics.github.io/#how-to-import-data-in-native-format) handler.
commit sha db14f22fc01001c189ce2a0f78ba2b6db2236f54
app/vmselect: stop `/api/v1/export/*` execution if client disconnects
commit sha 6d8c23fdbd4b814484d61af671a412e648b02674
app/{vminsert,vmselect}: skip accountID and projectID when marshaling/unmarshaling MetricName in /api/v1/export/native and /api/v1/import/native This is needed in order to be able to migrate native data from/to single-node VictoriaMetrics
commit sha 7072db75cb50bac5074113d08b01cb5f1dab229f
lib/protoparser: use 64KB read buffer instead of default 4KB buffer provided by net/http.Server This should reduce syscall overhead when reading big amounts of data
commit sha 8df33bd5c1d74f71069404a6efa9f51aadf634e4
app/{vminsert,vmagent}: improve data ingestion speed over a single connection Process data obtianed from a single connection on all the available CPU cores.
push time in 21 hours
push eventVictoriaMetrics/VictoriaMetrics
commit sha 24ca30bf661b873daea68755da292bfb1e4e114f
lib/storage: correctly use maxBlockSize in various checks Previously `maxBlockSize` has been multiplied by 8 in certain checks. This is unnecessary.
commit sha 23bdc1f1074036b57f3690e3a0023e117b93db57
app/vmselect/netstorage: do not spend CPU time on unpacking empty blocks during `/api/v1/series` calls
commit sha bab6a15ae0d0e9fc376b5ce9721abf4eebfc9324
lib/storage: remove unused `fetchData` arg from BlockRef.MustReadBlock This arg became unused after 23bdc1f1074036b57f3690e3a0023e117b93db57
commit sha 82973f8ae7ea23168c3cfa9068898847ea568f98
Revert "lib/storage: remove unused `fetchData` arg from BlockRef.MustReadBlock" This reverts commit bab6a15ae0d0e9fc376b5ce9721abf4eebfc9324. Reason for revert: the `fetchData` arg is used in cluster branch. Leaving this arg in master branch makes smaller the diff with cluster branch.
commit sha b6a976b98dc37564cfdbc613100beb97fe681592
app/vmagent: reduce memory usage when importing data via /api/v1/import Previously vmagent could use big amounts of RAM when each ingested JSON line contained many samples.
commit sha c00627c1039680a8dba1e6bdfb4991726e4cba90
app/vminsert: code prettifying
commit sha b4bf722d8f5a8bd953cb8c6aade79fc6a8485f77
lib/protoparser: use all the available CPU cores for processing ingested data from a single /api/v1/import stream Previously a single data ingestion stream to /api/v1/import could load only a single CPU core.
commit sha 95688cbfc50cfc9dde6b1615c9e862b86967697a
all: add native format for data export and import The data can be exported via [/api/v1/export/native](https://victoriametrics.github.io/#how-to-export-data-in-native-format) handler and imported via [/api/v1/import/native](https://victoriametrics.github.io/#how-to-import-data-in-native-format) handler.
commit sha 1b3efccb24143a1063cc73b09fa3973c3fa1f9ad
app/vmselect: stop `/api/v1/export/*` execution if client disconnects
commit sha 5cdad60a6fd369eb2514bb75be086dfe079e0d64
lib/protoparser: use 64KB read buffer instead of default 4KB buffer provided by net/http.Server This should reduce syscall overhead when reading big amounts of data
commit sha 978c6b4ba9a4c6c58c04ae454bea3eaa98fbd731
docs/Cluster-VictoriaMetrics.md: sync with cluster branch
commit sha 124f78857babfd143030284167990db3c65a099f
app/{vminsert,vmagent}: improve data ingestion speed over a single connection Process data obtianed from a single connection on all the available CPU cores.
push time in 21 hours
issue closedVictoriaMetrics/VictoriaMetrics
vm-backup googleapi: Error 503: Backend Error
Describe the bug During backup with
        {{ victoriametrics_root }}/vmbackup-prod
        -dst gcs://{{ vmbackup_bucket_path }}
        -snapshotName {{ snapshot_name }}
        -storageDataPath {{ victoriametrics_data_dir }}
        -origin gcs://{{ vmbackup_bucket_path }}
        -maxBytesPerSecond {{ vmbackup_max_upload_speed }}
        -loggerOutput {{ vmbackup_logging }}
        -concurrency {{ vmbackup_concurency }}
        -credsFilePath {{ vmbackup_creds_file }}
daily backup failed. On all three storage nodes with googleapi: Error 503: Backend Error
To Reproduce no idea. got once. Probably we should retry here
Expected behavior Backup done correctly
Screenshots If applicable, add screenshots to help explain your problem.
Version vmbackup-20200303-194040-tags-v1.34.2-0-g0b1e877a
$ ./victoria-metrics-prod --version
victoria-metrics-20190730-121249-heads-single-node-0-g671d9e55
closed time in 4 days
freeseacher
issue commentVictoriaMetrics/VictoriaMetrics
vm-backup googleapi: Error 503: Backend Error
Thanks for the update! Then closing this issue in the hope it has been fixed at Google cloud SDK side.
comment created time in 4 days
issue commentVictoriaMetrics/VictoriaMetrics
vm-backup googleapi: Error 503: Backend Error
@freeseacher , could you check whether vmbackup from new releases still emits googleapi: Error 503: Backend Error?
comment created time in 5 days
issue commentVictoriaMetrics/VictoriaMetrics
Best way to migrate big VictoriaMetrics instance from on prem cluster into the cloud
The best way to migrate big amounts of data between VictoriaMetrics instances is to export the data via /api/v1/export from one instance and then import it to another instance /api/v1/import. This approach works for migrating data from single-node to cluster instance and vice versa. Note that cluster version of VictoriaMetrics has slightly different urls comparing to single-node version - see these docs for details.
As you noted above, this approach may work slowly or may use big amounts of RAM during export when match[] query arg matches all the time series, i.e. {__name__!=""}. The solution is to try splitting time series into multiple groups by certain label filters and export each such group individually. For instance, if the database contains a million of unique time series with label deployment_id with label values starting from random digit, then it is possible to split such time series into 10 groups by 100K time series per group with the following match[] filter: {deployment_id=~"0.*"}, {deployment_id=~"1.*"}, ... , {deployment_id=~"9.*"}. Then each such group can be migrated independently of each other. I'd suggest investigating the output of /api/v1/status/tsdb page in order to determine
labels, which could be used for even data splitting.
Can we just copy over /storage data directly? I assume it is not going to work?
Unfortunately this doesn't work, because cluster version and single-node version of VictoriaMetrics have different data formats - cluster version additionally stores accountID and projectID (aka tenants).
It is clear that the approach outlined above may be slow and awkward to execute. So let's re-purpose this issue to feature request on fast data migration between VictoriaMetrics instances.

comment created time in 5 days
issue closedVictoriaMetrics/VictoriaMetrics
Grafana Instant query with table don't work correctly
Describe the bug When using Grafana Instant queries and plot them as a table (for e.g. to plot label values), the table shows multiple series, instead of a single series. This keeps changing on refresh (more clear in screenshots below)
To Reproduce
Plot labels of two queries onto a Grafana Table by using instant queries. Only happens with there are two queries that are bing plotted.
Expected behavior This is the expected output:
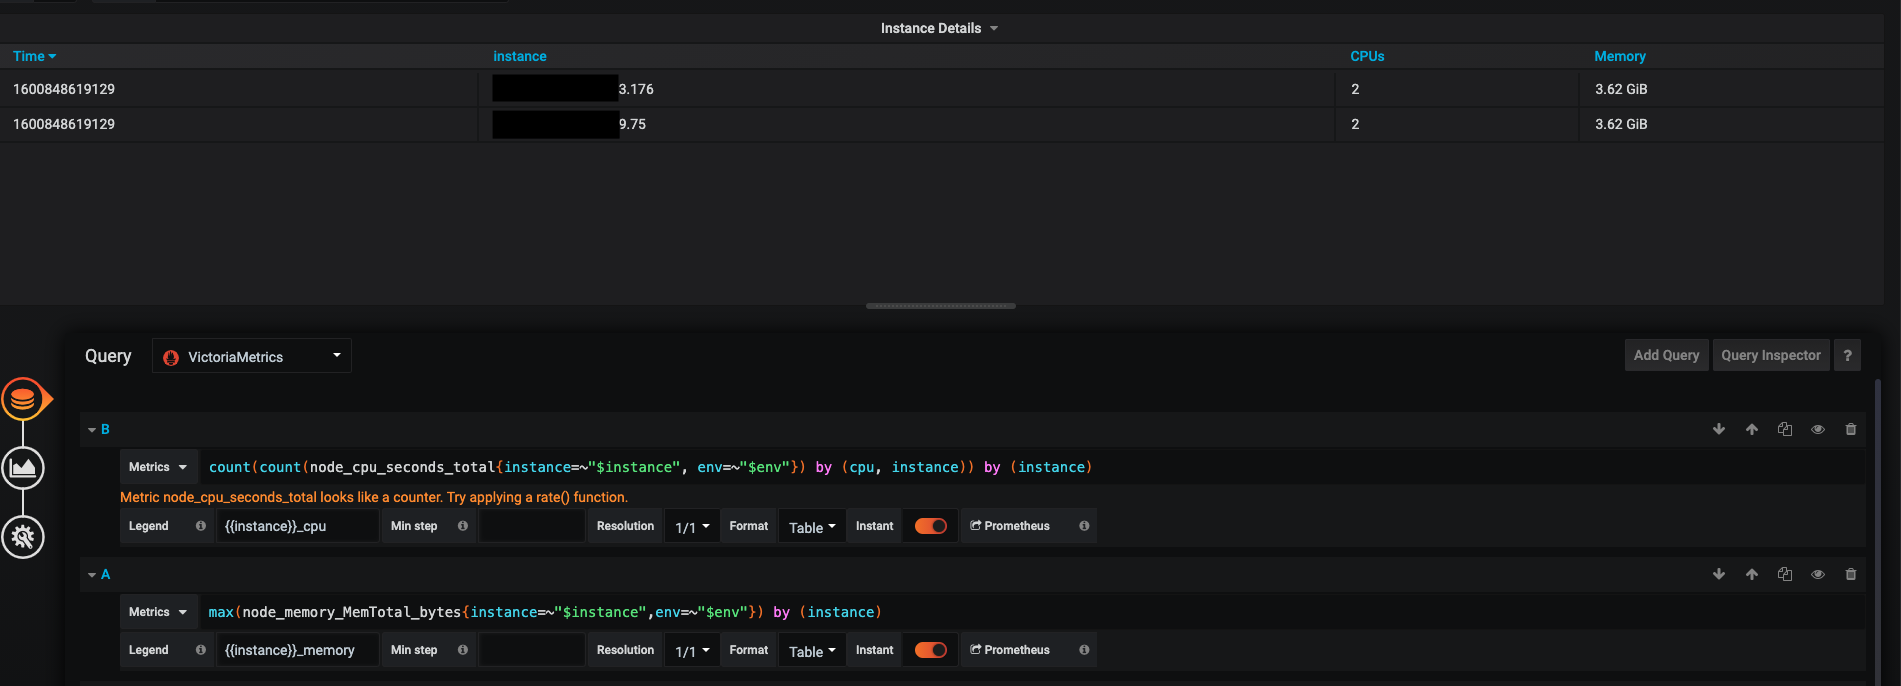
But on refresh it'll change to:

Version
$ ./victoria-metrics-prod --version
victoriametrics02 : victoria-metrics-20200911-214525-tags-v1.41.0-0-gba74d0c14
Used command-line flags
--retentionPeriod=3 --memory.allowedPercent=60
Additional Context
- Metrics are scraped via VMagent (1min scrape interval)
- Parallel Prometheus cluster doesn't exhibit this issue (same interval as VMagent)
- Seems to be related to the Timestamps that don't match between the two queries, but why does that not happen in Prometheus
closed time in 5 days
raags
issue commentVictoriaMetrics/VictoriaMetrics
Grafana Instant query with table don't work correctly
Closing the issue as duplicate for #720 .
comment created time in 5 days
issue commentVictoriaMetrics/VictoriaMetrics
Grafana Instant query with table don't work correctly
This looks like a duplicate for https://github.com/VictoriaMetrics/VictoriaMetrics/issues/720 .
comment created time in 5 days
issue commentVictoriaMetrics/VictoriaMetrics
Running gmake victoria-metrics-pure on BSD failed from release source
I must say unless i m mistaken, isn't that a bit strange to embed third party libs like that ?https://github.com/VictoriaMetrics/VictoriaMetrics/tree/master/vendor/cloud.google.com/go
This is called vendoring in Go. VictoriaMetrics uses third-party libraries (aka Go packages). All the source code for these packages is placed under vendor directory. This provides the following benefits:
- This makes possible to build VictoriaMetrics from sources in an environment without access to Internet and without the need to manually install dependencies before building VictoriaMetrics, since
vendorfolder contains all the source code for all third-party dependencies. - This makes easy grep'ing across all the source code including all thrid-party dependencies.
- This makes easy investigating changes to third-party dependencies via git history.
Go provides simple mechanism for determining why the given third-party dependency is needed. For example:
$ go mod why cloud.google.com/go
# cloud.google.com/go
github.com/VictoriaMetrics/VictoriaMetrics/lib/backup/gcsremote
cloud.google.com/go/storage
cloud.google.com/go
The output for go mod why says that cloud.google.com/go is transitively used by github.com/VictoriaMetrics/VictoriaMetrics/lib/backup/gcsremote.
comment created time in 5 days
issue commentVictoriaMetrics/VictoriaMetrics
range queries don't respect maxStalenessInterval
The bug must be fixed in the commit c584aece388fa46cd2eecd6080fdd9e70d84325e . @propertone , could you build VictoriaMetrics from this commit according to these docs and verify whether -search.maxStalenessInterval command-line flag works there as expected?

comment created time in 5 days
push eventVictoriaMetrics/VictoriaMetrics
commit sha 265d892a8ca072c9c939126ee71be01332f29552
vendor: `make vendor-update`
commit sha 543f3aea97465cb753af6e96f9d4de08371a3e86
all: consistently use "%w" formatting in fmt.Errorf for wrapped errors
commit sha b8bce348c50fe5372abc3f7e139c266b698ced2d
app/vmselect/promql: properly limit implicitly set rollup window to `-search.maxStalenessInterval` Updates https://github.com/VictoriaMetrics/VictoriaMetrics/issues/784
push time in 5 days
push eventVictoriaMetrics/VictoriaMetrics
commit sha 2985077c3591b625c3384d189ae6d4e00ffb423b
all: consistently use "%w" formatting in fmt.Errorf for wrapped errors
commit sha c584aece388fa46cd2eecd6080fdd9e70d84325e
app/vmselect/promql: properly limit implicitly set rollup window to `-search.maxStalenessInterval` Updates https://github.com/VictoriaMetrics/VictoriaMetrics/issues/784
push time in 5 days
create barnchVictoriaMetrics/VictoriaMetrics
branch : pmm-6401-read-prometheus-data-files
created branch time in 5 days
push eventVictoriaMetrics/VictoriaMetrics
commit sha 30c72698141a737bb25ea72b47c28177d0860026
vendor: `make vendor-update`
push time in 5 days
push eventVictoriaMetrics/VictoriaMetrics
commit sha 8627365b48b33492ff63b51befc38a495867809b
app/vmselect/prometheus: code cleanup after 3ba507000ca78b35cbe2db8106131c8376450ba6
push time in 6 days
push eventVictoriaMetrics/VictoriaMetrics
commit sha 27500d7d4c94776508697fa56618da8e1b69774d
app/vmselect/prometheus: code cleanup after 3ba507000ca78b35cbe2db8106131c8376450ba6
push time in 6 days
issue commentVictoriaMetrics/VictoriaMetrics
Grafana Table doesn't merge queries results with Victoria Metrics datasource
@Muxa1L , thanks for the spot! It must be fixed in the following commits:
- Single-node VictoriaMetrics: 3ba507000ca78b35cbe2db8106131c8376450ba6
- Cluster VictoriaMetrics: 1fce79518a58956c8cc8d62654907edbefe53a04
Unfortunately these commits weren't included in v1.41.1, but they will be included in the next release.

comment created time in 6 days
push eventVictoriaMetrics/VictoriaMetrics
commit sha 1fce79518a58956c8cc8d62654907edbefe53a04
app/vmselect/prometheus: return timestamps from `/api/v1/query`, which match the `time` query arg Updates https://github.com/VictoriaMetrics/VictoriaMetrics/issues/720
push time in 6 days
push eventVictoriaMetrics/VictoriaMetrics
commit sha 3ba507000ca78b35cbe2db8106131c8376450ba6
app/vmselect/prometheus: return timestamps from `/api/v1/query`, which match the `time` query arg Updates https://github.com/VictoriaMetrics/VictoriaMetrics/issues/720
push time in 6 days
issue commentVictoriaMetrics/VictoriaMetrics
Spaces in tags will broke graphite reciever
VictoriaMetrics should properly emit errors when it cannot parse timestamps and/or values in Graphite line starting from v1.41.1. Closing this issue as fixed.

comment created time in 6 days
issue closedVictoriaMetrics/VictoriaMetrics
Spaces in tags will broke graphite reciever
I have VM cluster setup. I'm trying to send metrics in Graphite format. And I found that if the tag value contains a space, that next uniq metrics with same first tag will be broken.
It's hard to explain, let me show you a code:
>>> echo 'metric;tag1=aaa1;tag2=bbb2;tag3=ccc3 2' | nc 127.0.0.1 2003
>>> curl 'http://localhost:8481/select/0/prometheus/api/v1/export?match[]=metric'

{"metric":{"__name__":"metric","tag1":"aaa1","tag2":"bbb2","tag3":"ccc3"},"values":[2,2],"timestamps":[1563200403000,1563200407000]}
Everething is fine.
Then I send metric with a space symbol in tags (tag2 and tag3)
>>> echo 'metric;tag1=aaa1;tag2=bb b2;tag3=cc c3 2' | nc 127.0.0.1 2003
>>> curl 'http://localhost:8481/select/0/prometheus/api/v1/export?match[]=metric'

{"metric":{"__name__":"metric","tag1":"aaa1","tag2":"bb"},"values":[0],"timestamps":[1563200424000]}
{"metric":{"__name__":"metric","tag1":"aaa1","tag2":"bbb2","tag3":"ccc3"},"values":[2,2],"timestamps":[1563200403000,1563200407000]}
I recieved the second metric poorly parsed. It's bad, but not the main issue.
If I trying to send the next metrics with different and correct tag2 and tag3 I didn't receive anything
>>> echo 'metric;tag1=aaa1;tag2=bb_b2;tag3=ccc3 2' | nc 127.0.0.1 2003
>>> curl 'http://localhost:8481/select/0/prometheus/api/v1/export?match[]=metric'

{"metric":{"__name__":"metric","tag1":"aaa1","tag2":"bb"},"values":[0],"timestamps":[1563200424000]}
{"metric":{"__name__":"metric","tag1":"aaa1","tag2":"bbb2","tag3":"ccc3"},"values":[2,2],"timestamps":[1563200403000,1563200407000]}
And if I change metrics next to tag1 to any others VM still refuse to save them. It works only if I change tag1 value to any other
>>> echo 'metric;tag1=aa_a1;tag2=bb_b2;tag3=ccc3 2' | nc 127.0.0.1 2003
>>> curl 'http://localhost:8481/select/0/prometheus/api/v1/export?match[]=metric'

{"metric":{"__name__":"metric","tag1":"aa_a1","tag2":"bb_b2","tag3":"ccc3"},"values":[2],"timestamps":[1563200569000]}
{"metric":{"__name__":"metric","tag1":"aaa1","tag2":"bb"},"values":[0],"timestamps":[1563200424000]}
{"metric":{"__name__":"metric","tag1":"aaa1","tag2":"bbb2","tag3":"ccc3"},"values":[2,2],"timestamps":[1563200403000,1563200407000]}


# As you can see if I add tag4 and tag5 instead of tag2 and tag3 it didn't change anything
>>> echo 'metric;tag1=aaa1;tag4=bbb2;tag5=ccc3 2' | nc 127.0.0.1 2003
>>> curl 'http://localhost:8481/select/0/prometheus/api/v1/export?match[]=metric'

{"metric":{"__name__":"metric","tag1":"aaa1","tag2":"bb"},"values":[0],"timestamps":[1563200424000]}
{"metric":{"__name__":"metric","tag1":"aaa1","tag2":"bbb2","tag3":"ccc3"},"values":[2,2,2],"timestamps":[1563200403000,1563200407000,1563201198000]}
{"metric":{"__name__":"metric","tag1":"aa_a1","tag2":"bb_b2","tag3":"ccc3"},"values":[2],"timestamps":[1563200569000]}
It's a very interesting mistake how the single broken metric can affect other didn't broken metrics.
closed time in 6 days
ctrlok
issue commentVictoriaMetrics/vmctl
Inf values are transformed to 0
FYI, VictoriaMetrics should properly parse +Inf and should properly emit errors when it cannot parse timestamps and/or values in all the supported text-based data ingestion protocols starting from release v1.41.1.

comment created time in 6 days
issue closedVictoriaMetrics/VictoriaMetrics
"(deleted)" files in /data/small* directories
Describe the bug VictoriaMetrics leaving not completely removed files
lsof | grep victoria | grep -c deleted
142359
lsof | grep deleted | awk '{print $10;}'
/data/victoriametrics/data/small/2020_08/12509375_11558539_20200807065635.791_20200807065717.993_1626FBD2B11EAAC2/values.bin
/data/victoriametrics/data/small/2020_08/12509375_11558539_20200807065635.791_20200807065717.993_1626FBD2B11EAAC2/index.bin
/data/victoriametrics/data/small/2020_08/5491622_5298795_20200810064325.700_20200810064358.140_1626FBD2B128ED58/timestamps.bin
/data/victoriametrics/data/small/2020_08/5491622_5298795_20200810064325.700_20200810064358.140_1626FBD2B128ED58/values.bin
/data/victoriametrics/data/small/2020_08/377844286_30473412_20200810062718.795_20200810063744.222_1626FBD2B128E9BE/timestamps.bin
/data/victoriametrics/data/small/2020_08/377844286_30473412_20200810062718.795_20200810063744.222_1626FBD2B128E9BE/values.bin
/data/victoriametrics/data/small/2020_08/377844286_30473412_20200810062718.795_20200810063744.222_1626FBD2B128E9BE/index.bin
[...]
it's not a NFS - just regular setup with SSD disks there are no errors in logs. single-node
To Reproduce
- run VictoriaMetrics
- wait few days
- run lsof | grep deleted | grep victoria
Expected behavior files should be removed properly
Version
The line returned when passing --version command line flag to binary. For example:
victoria-metrics-20200714-141946-tags-v1.38.1-0-gb442a42d8
single-node
Used command-line flags
-httpListenAddr=:8428 -storageDataPath=/data/victoriametrics/ -memory.allowedPercent=80 -retentionPeriod=2 -search.maxUniqueTimeseries=10000000000 -search.maxConcurrentRequests=16 -loggerFormat=json
closed time in 6 days
xor-eax-ebx
issue commentVictoriaMetrics/VictoriaMetrics
"(deleted)" files in /data/small* directories
FYI, the bugfix has been included in release v1.41.1. Closing the issue as fixed.
@xor-eax-ebx , could you upgrade VictoriaMetrics to v1.41.1 and verify whether the issue is gone in your case? If it still exists, then please re-open the issue.
comment created time in 6 days
issue commentVictoriaMetrics/VictoriaMetrics
vmselect is killed by oom-killer when quering export API
FYI, the commit https://github.com/VictoriaMetrics/VictoriaMetrics/commit/89d652b583cb04e9cf8a8c6090ed7f20d68daa3e has been included in v1.41.1.

comment created time in 6 days
issue closedVictoriaMetrics/VictoriaMetrics
Option to disable timestamp in logs
Is your feature request related to a problem? Please describe. When victoria-metrics runs on kubernetes it is redundant to put timestamp into log records because kubernetes does this as well. The same happens in case of VM runs as a systemd unit. Journald already adds timestamp in logs.
Describe the solution you'd like it would be nice to have an argument for command line which disables timestamp in log records
closed time in 6 days
varuzam
issue commentVictoriaMetrics/VictoriaMetrics
Option to disable timestamp in logs
FYI, the -loggerDisableTimestamps command-line flag has been added in v1.41.1. Closing this feature request as done.
comment created time in 6 days
issue closedVictoriaMetrics/VictoriaMetrics
Add backoff time flag to vmAlert
Is your feature request related to a problem? Please describe.
In Our usage, We use vmAgent as a scraper, It will scrape target metrics, and then push data to vmstorage, However , When The data is very huge , It will takes some time.
And I do some recording rule in vmAlert, Some time the recording rule calc less data than vmagent scrape because the latency write.
Describe the solution you'd like
And a flag like --query.backoff flag to wait the write end.
closed time in 6 days
weenxin
issue commentVictoriaMetrics/VictoriaMetrics
Add backoff time flag to vmAlert
FYI, the -datasource.lookback command-line flag has been added to vmalert starting from v1.41.1. Closing this feature request as done.
comment created time in 6 days
issue closedVictoriaMetrics/VictoriaMetrics
Hide inline basic auth part of remoteWrite.url in logs of vmagent
Describe the solution you'd like
Hide password in logs in case if user want's to use basic auth credentials as part of remoteWrite.url e.g. --remoteWrite.url=https://username:[email protected]/api/v1/write
Additional context If username and password is set this way they will be showed up in logs and will be partially masked in error logs:
2020-09-16T15:54:37.079Z    info    VictoriaMetrics/lib/logger/flag.go:11   build version: vmagent-20200815-125807-tags-v1.40.0-0-ged00eb3f3
2020-09-16T15:54:37.079Z    info    VictoriaMetrics/lib/logger/flag.go:12   command line flags
2020-09-16T15:54:37.079Z    info    VictoriaMetrics/lib/logger/flag.go:20   flag "csvTrimTimestamp" = "1ms"
2020-09-16T15:54:37.079Z    info    VictoriaMetrics/lib/logger/flag.go:20   flag "dryRun" = "false"
2020-09-16T15:54:37.080Z    info    VictoriaMetrics/lib/logger/flag.go:20   flag "enableTCP6" = "false"
2020-09-16T15:54:37.080Z    info    VictoriaMetrics/lib/logger/flag.go:20   flag "envflag.enable" = "false"
2020-09-16T15:54:37.080Z    info    VictoriaMetrics/lib/logger/flag.go:20   flag "envflag.prefix" = ""
2020-09-16T15:54:37.080Z    info    VictoriaMetrics/lib/logger/flag.go:20   flag "fs.disableMmap" = "false"
2020-09-16T15:54:37.080Z    info    VictoriaMetrics/lib/logger/flag.go:20   flag "graphiteListenAddr" = ""
2020-09-16T15:54:37.080Z    info    VictoriaMetrics/lib/logger/flag.go:20   flag "graphiteTrimTimestamp" = "1s"
2020-09-16T15:54:37.080Z    info    VictoriaMetrics/lib/logger/flag.go:20   flag "http.disableResponseCompression" = "false"
2020-09-16T15:54:37.080Z    info    VictoriaMetrics/lib/logger/flag.go:20   flag "http.maxGracefulShutdownDuration" = "7s"
2020-09-16T15:54:37.080Z    info    VictoriaMetrics/lib/logger/flag.go:20   flag "http.pathPrefix" = ""
2020-09-16T15:54:37.080Z    info    VictoriaMetrics/lib/logger/flag.go:20   flag "http.shutdownDelay" = "0s"
2020-09-16T15:54:37.080Z    info    VictoriaMetrics/lib/logger/flag.go:20   flag "httpAuth.password" = "secret"
2020-09-16T15:54:37.080Z    info    VictoriaMetrics/lib/logger/flag.go:20   flag "httpAuth.username" = ""
2020-09-16T15:54:37.080Z    info    VictoriaMetrics/lib/logger/flag.go:20   flag "httpListenAddr" = ":8429"
2020-09-16T15:54:37.080Z    info    VictoriaMetrics/lib/logger/flag.go:20   flag "import.maxLineLen" = "104857600"
2020-09-16T15:54:37.080Z    info    VictoriaMetrics/lib/logger/flag.go:20   flag "influxListenAddr" = ""
2020-09-16T15:54:37.080Z    info    VictoriaMetrics/lib/logger/flag.go:20   flag "influxMeasurementFieldSeparator" = "_"
2020-09-16T15:54:37.081Z    info    VictoriaMetrics/lib/logger/flag.go:20   flag "influxSkipMeasurement" = "false"
2020-09-16T15:54:37.081Z    info    VictoriaMetrics/lib/logger/flag.go:20   flag "influxSkipSingleField" = "false"
2020-09-16T15:54:37.081Z    info    VictoriaMetrics/lib/logger/flag.go:20   flag "influxTrimTimestamp" = "1ms"
2020-09-16T15:54:37.081Z    info    VictoriaMetrics/lib/logger/flag.go:20   flag "insert.maxQueueDuration" = "1m0s"
2020-09-16T15:54:37.081Z    info    VictoriaMetrics/lib/logger/flag.go:20   flag "loggerErrorsPerSecondLimit" = "10"
2020-09-16T15:54:37.081Z    info    VictoriaMetrics/lib/logger/flag.go:20   flag "loggerFormat" = "default"
2020-09-16T15:54:37.081Z    info    VictoriaMetrics/lib/logger/flag.go:20   flag "loggerLevel" = "INFO"
2020-09-16T15:54:37.081Z    info    VictoriaMetrics/lib/logger/flag.go:20   flag "loggerOutput" = "stderr"
2020-09-16T15:54:37.081Z    info    VictoriaMetrics/lib/logger/flag.go:20   flag "maxConcurrentInserts" = "16"
2020-09-16T15:54:37.081Z    info    VictoriaMetrics/lib/logger/flag.go:20   flag "maxInsertRequestSize" = "33554432"
2020-09-16T15:54:37.081Z    info    VictoriaMetrics/lib/logger/flag.go:20   flag "memory.allowedBytes" = "0"
2020-09-16T15:54:37.081Z    info    VictoriaMetrics/lib/logger/flag.go:20   flag "memory.allowedPercent" = "60"
2020-09-16T15:54:37.081Z    info    VictoriaMetrics/lib/logger/flag.go:20   flag "metricsAuthKey" = "secret"
2020-09-16T15:54:37.081Z    info    VictoriaMetrics/lib/logger/flag.go:20   flag "opentsdbHTTPListenAddr" = ""
2020-09-16T15:54:37.081Z    info    VictoriaMetrics/lib/logger/flag.go:20   flag "opentsdbListenAddr" = ""
2020-09-16T15:54:37.082Z    info    VictoriaMetrics/lib/logger/flag.go:20   flag "opentsdbTrimTimestamp" = "1s"
2020-09-16T15:54:37.082Z    info    VictoriaMetrics/lib/logger/flag.go:20   flag "opentsdbhttp.maxInsertRequestSize" = "33554432"
2020-09-16T15:54:37.082Z    info    VictoriaMetrics/lib/logger/flag.go:20   flag "opentsdbhttpTrimTimestamp" = "1ms"
2020-09-16T15:54:37.082Z    info    VictoriaMetrics/lib/logger/flag.go:20   flag "pprofAuthKey" = "secret"
2020-09-16T15:54:37.082Z    info    VictoriaMetrics/lib/logger/flag.go:20   flag "promscrape.config" = "/config/agent.yaml"
2020-09-16T15:54:37.082Z    info    VictoriaMetrics/lib/logger/flag.go:20   flag "promscrape.config.dryRun" = "false"
2020-09-16T15:54:37.082Z    info    VictoriaMetrics/lib/logger/flag.go:20   flag "promscrape.config.strictParse" = "true"
2020-09-16T15:54:37.082Z    info    VictoriaMetrics/lib/logger/flag.go:20   flag "promscrape.configCheckInterval" = "0s"
2020-09-16T15:54:37.082Z    info    VictoriaMetrics/lib/logger/flag.go:20   flag "promscrape.consulSDCheckInterval" = "30s"
2020-09-16T15:54:37.082Z    info    VictoriaMetrics/lib/logger/flag.go:20   flag "promscrape.disableCompression" = "false"
2020-09-16T15:54:37.082Z    info    VictoriaMetrics/lib/logger/flag.go:20   flag "promscrape.disableKeepAlive" = "false"
2020-09-16T15:54:37.082Z    info    VictoriaMetrics/lib/logger/flag.go:20   flag "promscrape.discovery.concurrency" = "100"
2020-09-16T15:54:37.082Z    info    VictoriaMetrics/lib/logger/flag.go:20   flag "promscrape.discovery.concurrentWaitTime" = "1m0s"
2020-09-16T15:54:37.082Z    info    VictoriaMetrics/lib/logger/flag.go:20   flag "promscrape.dnsSDCheckInterval" = "30s"
2020-09-16T15:54:37.082Z    info    VictoriaMetrics/lib/logger/flag.go:20   flag "promscrape.ec2SDCheckInterval" = "1m0s"
2020-09-16T15:54:37.083Z    info    VictoriaMetrics/lib/logger/flag.go:20   flag "promscrape.fileSDCheckInterval" = "30s"
2020-09-16T15:54:37.083Z    info    VictoriaMetrics/lib/logger/flag.go:20   flag "promscrape.gceSDCheckInterval" = "1m0s"
2020-09-16T15:54:37.083Z    info    VictoriaMetrics/lib/logger/flag.go:20   flag "promscrape.kubernetesSDCheckInterval" = "30s"
2020-09-16T15:54:37.083Z    info    VictoriaMetrics/lib/logger/flag.go:20   flag "promscrape.maxScrapeSize" = "16777216"
2020-09-16T15:54:37.083Z    info    VictoriaMetrics/lib/logger/flag.go:20   flag "promscrape.suppressScrapeErrors" = "false"
2020-09-16T15:54:37.083Z    info    VictoriaMetrics/lib/logger/flag.go:20   flag "remoteWrite.basicAuth.password" = "secret"
2020-09-16T15:54:37.083Z    info    VictoriaMetrics/lib/logger/flag.go:20   flag "remoteWrite.basicAuth.username" = ""
2020-09-16T15:54:37.083Z    info    VictoriaMetrics/lib/logger/flag.go:20   flag "remoteWrite.bearerToken" = ""
2020-09-16T15:54:37.083Z    info    VictoriaMetrics/lib/logger/flag.go:20   flag "remoteWrite.decimalPlaces" = "0"
2020-09-16T15:54:37.083Z    info    VictoriaMetrics/lib/logger/flag.go:20   flag "remoteWrite.flushInterval" = "1s"
2020-09-16T15:54:37.083Z    info    VictoriaMetrics/lib/logger/flag.go:20   flag "remoteWrite.label" = ""
2020-09-16T15:54:37.083Z    info    VictoriaMetrics/lib/logger/flag.go:20   flag "remoteWrite.maxBlockSize" = "33554432"
2020-09-16T15:54:37.083Z    info    VictoriaMetrics/lib/logger/flag.go:20   flag "remoteWrite.maxDiskUsagePerURL" = "0"
2020-09-16T15:54:37.083Z    info    VictoriaMetrics/lib/logger/flag.go:20   flag "remoteWrite.proxyURL" = ""
2020-09-16T15:54:37.083Z    info    VictoriaMetrics/lib/logger/flag.go:20   flag "remoteWrite.queues" = "20"
2020-09-16T15:54:37.083Z    info    VictoriaMetrics/lib/logger/flag.go:20   flag "remoteWrite.relabelConfig" = ""
2020-09-16T15:54:37.083Z    info    VictoriaMetrics/lib/logger/flag.go:20   flag "remoteWrite.sendTimeout" = "1m0s"
2020-09-16T15:54:37.083Z    info    VictoriaMetrics/lib/logger/flag.go:20   flag "remoteWrite.showURL" = "false"
2020-09-16T15:54:37.083Z    info    VictoriaMetrics/lib/logger/flag.go:20   flag "remoteWrite.tlsCAFile" = ""
2020-09-16T15:54:37.083Z    info    VictoriaMetrics/lib/logger/flag.go:20   flag "remoteWrite.tlsCertFile" = ""
2020-09-16T15:54:37.083Z    info    VictoriaMetrics/lib/logger/flag.go:20   flag "remoteWrite.tlsInsecureSkipVerify" = "false"
2020-09-16T15:54:37.083Z    info    VictoriaMetrics/lib/logger/flag.go:20   flag "remoteWrite.tlsKeyFile" = "secret"
2020-09-16T15:54:37.083Z    info    VictoriaMetrics/lib/logger/flag.go:20   flag "remoteWrite.tlsServerName" = ""
2020-09-16T15:54:37.083Z    info    VictoriaMetrics/lib/logger/flag.go:20   flag "remoteWrite.tmpDataPath" = "vmagent-remotewrite-data"
2020-09-16T15:54:37.083Z    info    VictoriaMetrics/lib/logger/flag.go:20   flag "remoteWrite.url" = "https://agent:[email protected]/api/v1/write"
2020-09-16T15:54:37.083Z    info    VictoriaMetrics/lib/logger/flag.go:20   flag "remoteWrite.urlRelabelConfig" = ""
2020-09-16T15:54:37.083Z    info    VictoriaMetrics/lib/logger/flag.go:20   flag "tls" = "false"
2020-09-16T15:54:37.083Z    info    VictoriaMetrics/lib/logger/flag.go:20   flag "tlsCertFile" = ""
2020-09-16T15:54:37.083Z    info    VictoriaMetrics/lib/logger/flag.go:20   flag "tlsKeyFile" = "secret"
2020-09-16T15:54:37.083Z    info    VictoriaMetrics/lib/logger/flag.go:20   flag "version" = "false"
2020-09-16T15:54:37.083Z    info    VictoriaMetrics/lib/cgroup/cpu.go:26    updating GOMAXPROCS to 1 according to cgroup CPU quota
2020-09-16T15:54:37.084Z    info    VictoriaMetrics/app/vmagent/main.go:80  starting vmagent at ":8429"...
2020-09-16T15:54:37.084Z    info    VictoriaMetrics/lib/memory/memory.go:45 limiting caches to 2576980377 bytes, leaving 1717986919 bytes to the OS according to -memory.allowedPercent=60.000000 and -memory.allowedBytes=0
2020-09-16T15:54:37.087Z    info    VictoriaMetrics/lib/persistentqueue/fastqueue.go:46 opened fast persistent queue at "vmagent-remotewrite-data/persistent-queue/AF03C634A296195F" with maxInmemoryBlocks=200
2020-09-16T15:54:37.087Z    info    VictoriaMetrics/app/vmagent/remotewrite/client.go:125   initialized client for -remoteWrite.url="https://agent:[email protected]/api/v1/write"
2020-09-16T15:54:37.087Z    info    VictoriaMetrics/app/vmagent/main.go:102 started vmagent in 0.004 seconds
2020-09-16T15:54:37.087Z    info    VictoriaMetrics/lib/httpserver/httpserver.go:77 starting http server at http://:8429/
2020-09-16T15:54:37.087Z    info    VictoriaMetrics/lib/httpserver/httpserver.go:78 pprof handlers are exposed at http://:8429/debug/pprof/
2020-09-16T15:54:37.088Z    info    VictoriaMetrics/lib/promscrape/scraper.go:78    reading Prometheus configs from "/config/agent.yaml"
2020-09-16T15:54:37.093Z    info    VictoriaMetrics/lib/promscrape/scraper.go:303   static_configs: added targets: 1, removed targets: 0; total targets: 1
2020-09-16T15:54:37.363Z    info    VictoriaMetrics/lib/promscrape/scraper.go:303   kubernetes_sd_configs: added targets: 62, removed targets: 0; total targets: 62
2020-09-16T16:30:29.135Z    error   VictoriaMetrics/app/vmagent/remotewrite/client.go:212   couldn't send a block with size 151051 bytes to "https://agent:[email protected]/api/v1/write": Post "https://username:***@remote-storage.com/api/v1/write": EOF; re-sending the block in 2.000 seconds
closed time in 6 days
ofen
issue commentVictoriaMetrics/VictoriaMetrics
Hide inline basic auth part of remoteWrite.url in logs of vmagent
FYI, all the occurrences of -remoteWrite.url in logs and metrics are substituted by secret-url text by default starting from v1.41.1. If you need -remoteWrite.url in logs and metrics, then pass -remoteWrite.showURL command-line flag to vmagent.
Closing the issue as resolved. @ofen , feel free re-opening it if you still see plain -remoteWrite.url in logs / metrics.
comment created time in 6 days
issue closedVictoriaMetrics/VictoriaMetrics
Saving metrics in vmagent persisten queue after improper power-off and restart
Is your feature request related to a problem? Please describe. Metrics which are stored at the vmagent persistent queue while there is no connection with the server, are lost if the host powered off or vmagent process has been killed.
Describe the solution you'd like After restart vmagent keeps all metrics that were in a queue before power-off or vmagent killed.
Describe alternatives you've considered A precision may not be ideal, but it will be good if just a few minutes of metrics history are lost after the incident.
Additional context We want to use vmagent as a part of fail-safe pipeline on POS Terminals, Scales and other Linux devices which are using in retail and may have no connection with Data Center and get powered off by unqualified personnel.
closed time in 6 days
alpi-ua
issue commentVictoriaMetrics/VictoriaMetrics
Saving metrics in vmagent persisten queue after improper power-off and restart
FYI, persistent queues in vmagent must become more durable starting from v1.41.1. Closing this issue as done.
@alpi-ua , feel free re-opening it if you still see significant data loss after unclean shutdown for vmagent v1.41.1 or newer.
comment created time in 6 days
issue closedVictoriaMetrics/VictoriaMetrics
ec2 service discovery works incorrectly
Describe the bug
vmagent doesn't support all prometheus ec2_sd_config features.
With prometheus ec2_sd_config is possible to use following auth methods in addition to AWS_KEY and AWS_SECRET vars:
- role_arn - sets explicit at ec2_sd_config
- instance iam role - sets implicit, when iam role assigned to ec2 instance and AWS_KEY with AWS_SECRET configuration isn't set.
To Reproduce based on this article Assign iam role to instance and create following configuration:
scrape_configs:
  - job_name: 'node'
    ec2_sd_configs:
      - region: eu-west-1
    # Discover instances in account 111111111111
    - port: 9100
      role_arn: arn:aws:iam::111111111111:role/prometheus-assume-role-PrometheusAssumeRole-KJ4TK9KJBPU7
with prometheus it works, vmagent returns error:
missing `access_key` in AWS_ACCESS_KEY_ID env var; probably, `access_key` must be set in `ec2_sd_config`?
Expected behavior
ec2_sd_config must return instances for scraping.
Version 1.41.0
closed time in 6 days
f41gh7
issue commentVictoriaMetrics/VictoriaMetrics
ec2 service discovery works incorrectly
FYI, support for role_arn and EC2 instance tokens has been included in v1.41.1. Closing this bug as fixed.
comment created time in 6 days
issue commentVictoriaMetrics/VictoriaMetrics
Can we speed up the getMetricIDsForDateTagFilter function by passing metricIDs?
FYI, enhancements mentioned above have been included in v1.41.1 . This should improve performance for queries with complex regexp filters.

comment created time in 6 days
release VictoriaMetrics/VictoriaMetrics
victoria-metrics-v1.41.1-cluster.tar.gz 19.46MB
victoria-metrics-v1.41.1-cluster_checksums.txt 0.10KB
victoria-metrics-v1.41.1.tar.gz 8.43MB
victoria-metrics-v1.41.1_checksums.txt 98B
vmutils-v1.41.1.tar.gz 36.81MB
released time in 6 days
created tagVictoriaMetrics/VictoriaMetrics
VictoriaMetrics - fast, cost-effective and scalable time series database
created time in 6 days
created tagVictoriaMetrics/VictoriaMetrics
VictoriaMetrics - fast, cost-effective and scalable time series database
created time in 6 days
push eventVictoriaMetrics/helm-charts
commit sha 0185ce75a1b6098d5d5df1360b71726dba31c927
Update docker image tag from v1.41.0 to v1.41.1
push time in 6 days
push eventVictoriaMetrics/helm-charts
commit sha de44b2afa7b48dd6a7aa5a592b5d0d8deec84154
Update docker image tag from v1.41.0 to v1.41.1
commit sha 8a4f5c6968b2de482f9c6ffd9b94a1354722cad4
make package merge
push time in 6 days
issue commentVictoriaMetrics/VictoriaMetrics
"(deleted)" files in /data/small* directories
It looks like the root cause of the issue has been identified and fixed in the commit 09b0f7c202f2c0e9a6b5879372fdb62d47f4a0fd . Previously VictoriaMetrics wasn't closing files on query timeout errors. Such files were eventually deleted after merging into bigger files, but they remained opened until VictoriaMetrics restart.
The commit will be included in the next release of VictoriaMetrics.
comment created time in 6 days
issue commentVictoriaMetrics/VictoriaMetrics
vmselect is killed by oom-killer when quering export API
@YuriGrigorov , could you verify whether cluster components of VictoriaMetrics properly determine the number of available CPU cores starting from the commit 89d652b583cb04e9cf8a8c6090ed7f20d68daa3e ?
comment created time in 6 days
push eventVictoriaMetrics/VictoriaMetrics
commit sha 31ce0e29cd5dfac98055a1f523c0b32afc6f005d
docs/Single-server-VictoriaMetrics.md: VictoriaMetrics properly stores Inf values after 26115891dba851ff8c98a222ef528b56a116ab20
commit sha 36eb5427ebcfe9a2e42b75caeb69f0ea6120b4c6
vendor: `make vendor-update`
commit sha 09b0f7c202f2c0e9a6b5879372fdb62d47f4a0fd
app/vmselect/netstorage: release search resources on timeout errors Previously these resources weren't released, which could lead to resource leaks.
commit sha 5c429658539b51cd6e8c4d3354ae0f14c9d4aa5f
lib/cgroup: attempt to obtain available CPU cores via /sys/devices/system/cpu/online See https://github.com/VictoriaMetrics/VictoriaMetrics/issues/685#issuecomment-674423728
commit sha bed25e3c2401bac767bbd67ab583e75802e4cba2
app/vmselect/netstorage: properly pre-allocate space for sbs
commit sha c5ef0e632790dfa30f905e79ad0074906ea5304c
lib/persistentqueue: protect from multiple concurrent opening for the same persistent queue
push time in 6 days
push eventVictoriaMetrics/VictoriaMetrics
commit sha 00ff01f7665933ede6478dc77ffa2a87011ac2f8
docs/Single-server-VictoriaMetrics.md: VictoriaMetrics properly stores Inf values after 26115891dba851ff8c98a222ef528b56a116ab20
commit sha 4ebd2fa5600cf2981f75f8071273f0c9141a01d2
vendor: `make vendor-update`
commit sha 89d652b583cb04e9cf8a8c6090ed7f20d68daa3e
lib/cgroup: attempt to obtain available CPU cores via /sys/devices/system/cpu/online See https://github.com/VictoriaMetrics/VictoriaMetrics/issues/685#issuecomment-674423728
commit sha 0468cdf33e42085d63da857f9201040c9245ecda
app/vmselect/netstorage: properly pre-allocate space for sbs
commit sha 90d2549428fd08b800fea75f102783d3de007c4e
lib/persistentqueue: protect from multiple concurrent opening for the same persistent queue
push time in 6 days
issue commentVictoriaMetrics/VictoriaMetrics
Graphite queries w/ carbonapi don't work
since 1.41.0 introduces a change that is not backward compatible with prior versions (data incompatibility) shouldn't it ideally be 2.0.0?
It is safe to upgrade from older releases to v1.41.0 and newer releases. It is impossible to downgrade to releases prior v1.41.0 though. The 2.0.0 version will be released only if it won't support seamless upgrade from older releases.

comment created time in 7 days
issue closedVictoriaMetrics/VictoriaMetrics
How can I directly push data to VictoriaMetrics instead of promtheus
hi I want to directly push the data of Prometheus structure to VictoriaMetrics instead of remote_write_api, what should I do?
closed time in 7 days
jinlongwang
issue commentVictoriaMetrics/VictoriaMetrics
How can I directly push data to VictoriaMetrics instead of promtheus
Closing the question as answered. @jinlongwang , feel free re-opening it if you have additional questions related to this one.
comment created time in 7 days
issue commentVictoriaMetrics/VictoriaMetrics
integrate function does not return what I expected (maybe newbie misunderstanding?)
In my tests this produced results that didn't have anything to do with what I'm looking for. When I divide the result bei number of hours in my time range, the result becomes more realistic but still almost 100 kWh off:
There is no need to wrap integrate(m[$__range]) into range_sum(). The original query should return an integral for m over the selected time range in Grafana.

comment created time in 7 days
issue commentVictoriaMetrics/fastcache
Support timeout for SaveToFile/SaveToFileConcurrent
I think it is better limiting the size of the cache, so it could be saved to disk in reasonable time. I see little sense in partially saved cache.

comment created time in 7 days
issue commentVictoriaMetrics/VictoriaMetrics
Can we speed up the getMetricIDsForDateTagFilter function by passing metricIDs?
But now isn't getMetricIDsForDateTagFilter lookup also divided into these two steps ?
Yes, but metricNames lookup is performed only when the number of metricIDs is relatively small.
Is it because a single index lookup has a higher overhead ?
Yes. Performance difference between sequential index scan and index lookup is multiple orders of magnitude (i.e. 1000x and more). So it is better to scan 100M of metricIDs than to look up 10K metricNames.
comment created time in 7 days
issue commentVictoriaMetrics/VictoriaMetrics
vmselect: ability to set connect / response timeout from storage nodes
Note that too big values for search.maxConcurrentRequests may result in vmstorage overload and trashing. So this config must be adjusted carefully.

comment created time in 7 days
issue commentVictoriaMetrics/VictoriaMetrics
vmselect: ability to set connect / response timeout from storage nodes
It looks like you hit the limit for concurrently executed queries, which can be adjusted with -search.maxConcurrentRequests command-line flag. If the limit is reached, then vmselect puts incoming requests in a wait queue until free slots are available for query processing. Requests may wait in the queue for up to -search.maxQueueDuration. After that vmselect logs the cannot handle more than ... concurrent search requests warning. Default value for -search.maxQueueDuration is 10 seconds.
Why requests may wait for 10 seconds in the queue if every request duration is limited by -search.storageTimeout=1s? Let's look at the following sequence:
-search.maxConcurrentRequests=16concurrent requests hitvmselect. All of them wait for-search.storageTimeout=1sdue to the slowvmstoragenode.- Additional requests arrived while the first 16 requests are waiting for response from slow
vmstoragenode. They are put in the wait queue. If these requests arrive at rate higher thansearch.maxConcurrentRequests / search.storageTimeout, i.e. 16 req/s for the case above, then the queue will constantly grow. This means that the majority of incoming requests will never reachvmstoragebecause the will be timed out in the wait queue.
How to deal with the issue for the given constant requests rate? Either increase search.maxConcurrentRequests or decrease search.storageTimeout.
The commit 69eb9783e6f5e7398faa1a5daad1765f9d5ed769 should partially address the issue by limiting max wait time in the queue to min(search.maxQueryTimeout, search.storageTimeout), so now all the requests must be finished in -search.storageTimeout.
comment created time in 7 days
push eventVictoriaMetrics/VictoriaMetrics
commit sha 69eb9783e6f5e7398faa1a5daad1765f9d5ed769
app/vmselect: make sure the request doesnt wait in pending queue more than the configured timeout Updates https://github.com/VictoriaMetrics/VictoriaMetrics/issues/711
push time in 7 days
push eventVictoriaMetrics/VictoriaMetrics
commit sha 3b1e3a03e091a6597c467c8032d78dfbdc12428a
app/vmselect: make sure the request doesnt wait in pending queue more than the configured timeout Updates https://github.com/VictoriaMetrics/VictoriaMetrics/issues/711
push time in 7 days
push eventVictoriaMetrics/VictoriaMetrics
commit sha a69234ed189d82f95fe2b64ae334ba64171da6b6
lib/storage: code prettifying after be5e1222f30e82f62230db07d4a9f76d538f5931 Updates https://github.com/VictoriaMetrics/VictoriaMetrics/issues/781
push time in 7 days
issue commentVictoriaMetrics/VictoriaMetrics
Can we speed up the getMetricIDsForDateTagFilter function by passing metricIDs?
We can use the index of MetricIDToMetricName to find all the metrics and then cycle through the collection for the rest of the TagFilter matches, which should be more efficient.
Unfortunately this doesn't work, since matching by metricName requires the following steps:
- locating and unmarshaling all the metricName values from the inverted index for the given metricIDs;
- matching found metricNames against all the tag filters.
These steps are usually much slower than locating and intersecting metricIDs by tag filters.
comment created time in 7 days
push eventVictoriaMetrics/VictoriaMetrics
commit sha bedc971398b9d7d801e43b449634287c39fb6299
docs: `make docs-sync`
commit sha ed473c94ff574a3c79f942665936a05482906550
docs/vmagent.md: typo fix
commit sha ad41e39350d84493c293cc7eb488c370ed2cf64f
add filter to getMetricIDs (#783) * add getMetricIDs filter * check nil filter before use
commit sha 31e341371bd4d4add0db1d84032e969d7d482619
lib/storage: code prettifying after be5e1222f30e82f62230db07d4a9f76d538f5931 Updates https://github.com/VictoriaMetrics/VictoriaMetrics/issues/781
push time in 7 days
pull request commentVictoriaMetrics/VictoriaMetrics
Thanks for great idea and implementation! This should help with the performance for regexp label filters.
comment created time in 7 days
push eventVictoriaMetrics/VictoriaMetrics
commit sha be5e1222f30e82f62230db07d4a9f76d538f5931
add filter to getMetricIDs (#783) * add getMetricIDs filter * check nil filter before use
push time in 7 days
PR merged VictoriaMetrics/VictoriaMetrics
Related issue https://github.com/VictoriaMetrics/VictoriaMetrics/issues/781
The code probably looks like this, but I don't know how to test the performance of this strategy in a real-world environment.
pr closed time in 7 days
issue commentVictoriaMetrics/VictoriaMetrics
[vmagent] error logs showing both skipped target and the kept one
There is a typo in your example which was hard to spot: regexp should be regex.
Thanks for spotting the typo! Fixed it in the original comment.

comment created time in 7 days
issue commentVictoriaMetrics/VictoriaMetrics
query results may incorrectly overlap time series
The other (related) issue is that range queries do not appear to respect the -search.maxStalenessInterval option, while the instant query does.
Could you file a separate issue regarding this bug?
comment created time in 7 days
issue commentVictoriaMetrics/VictoriaMetrics
inf datapoint causes other values to be truncated to integer
I couldn't tell from the commit. Will it be possible to query on Inf, like count(foo == Inf)?
It seems to be working in the same way as in Prometheus. But, to be honest, I'm surprised with this, since, according to math rules, the result of inf == inf is undetermined.
comment created time in 7 days
push eventVictoriaMetrics/VictoriaMetrics
commit sha 94f7d00537e02e53e506f9dfdf852f35ad523176
docs/vmagent.md: typo fix
push time in 7 days
push eventVictoriaMetrics/VictoriaMetrics
commit sha f6f5c4118c78d0318d1917e5a41d7f16b622baba
docs: `make docs-sync`
push time in 7 days
issue commentVictoriaMetrics/VictoriaMetrics
vmalert sends wrong request to backend (loki)
Try upgrading Loki to the latest release - probably this will help fixing the issue.

comment created time in 7 days
issue commentstarsliao/Prometheus
Can you add support for victoriametrics?
FYI, it looks like the source of the issue has been identified and fixed at https://github.com/VictoriaMetrics/VictoriaMetrics/issues/720 . The bugfix will be included in the next release of VictoriaMetrics.

comment created time in 7 days
push eventVictoriaMetrics/VictoriaMetrics
commit sha e56472564128483902a8b2d8b7b58caf5b7cc82f
app/vmselect/searchutils: fixed tests after 2eb72e09ab7bd3208cfbe08a08938f043ea4e876
push time in 7 days
push eventVictoriaMetrics/VictoriaMetrics
commit sha 00b5145c69bdebda6a691863c9fdc63d7668ef0f
app/vmselect/searchutils: fixed tests after 2eb72e09ab7bd3208cfbe08a08938f043ea4e876
push time in 7 days
issue commentVictoriaMetrics/VictoriaMetrics
Grafana Table doesn't merge queries results with Victoria Metrics datasource
The issue must be fixed in the following commits:
- Single-node VictoriaMetrics - 2eb72e09ab7bd3208cfbe08a08938f043ea4e876
- Cluster VictoriaMetrics - 07c622633476d61e9ceef646a41e9e3f06fd7fd4
The bugfix rounds default time value to seconds when the query to /api/v1/query doesn't contain time query arg. This is a workaround, which reduces the probability of the original issue. The proper fix should be applied on Grafana side - it must pass time query arg with each query to /api/v1/query.
comment created time in 7 days
push eventVictoriaMetrics/VictoriaMetrics
commit sha 07c622633476d61e9ceef646a41e9e3f06fd7fd4
app/vmselect: use `time` value rounded to seconds if it isnt passed to `/api/v1/query` Updates https://github.com/VictoriaMetrics/VictoriaMetrics/issues/720
push time in 7 days
push eventVictoriaMetrics/VictoriaMetrics
commit sha 2eb72e09ab7bd3208cfbe08a08938f043ea4e876
app/vmselect: use `time` value rounded to seconds if it isnt passed to `/api/v1/query` Updates https://github.com/VictoriaMetrics/VictoriaMetrics/issues/720
push time in 7 days
issue commentVictoriaMetrics/VictoriaMetrics
Victoria-metrics data usage started growing
It looks like time series churn rate (the first graph) and the number of unique time series (the second graph) has been increased in the middle of August. But there is nothing special at the beginning of July when new Prometheus version has been installed according to the initial bug report. Probably, newer versions of Prometheus introduced instability for the real interval between scrapes? This may result in not so good compression ratio for timestamps data.

comment created time in 7 days
issue commentVictoriaMetrics/helm-charts
Duplicate Scrape Target Error on Kube-DNS
I just think it would be ideal to have a configuration option that allowed you to ignore those errors. Then you wouldn't have to worry about making it so that you only got one target. You could just set your labels up so you only got one and the duplicates would be eliminated by victoria without having to do anything else.
VictoriaMetrics already leaves only a single target if it sees duplicate targets with identical set of labels. I don't think it is good idea to suppress such errors, since they point to improper configuration for relabeling, which must be investigated and fixed instead of silently ignored.

comment created time in 7 days
issue commentVictoriaMetrics/VictoriaMetrics
Can we speed up the getMetricIDsForDateTagFilter function by passing metricIDs?
This approach looks promising! @faceair , could you prepare a pull request for further investigation? Make sure it properly handles both positive and negative matches. I.e. foo{bar!="baz"} and foo{bar!~"baz.*"} shouldn't break after the change.
comment created time in 7 days
issue commentVictoriaMetrics/VictoriaMetrics
Option to disable timestamp in logs
The -loggerDisableTimestamps command-line flag has been added in the following commits:
- Single-node version: 29108cc53e42d29a41bc3ff6e70b36a8c5788db2
- Cluster version: d32c3f747c383dcc12ce303ad1c5b18a72a8917b
@varuzam , could you build VictoriaMetrics from these commits and verify whether it works as expected? See build instructions for single-node VictoriaMetrics and build instructions for cluster version.
comment created time in 7 days
push eventVictoriaMetrics/VictoriaMetrics
commit sha 0069353d5e8b08a0edc40431bd1a769d63e0bfd6
Add improvements to ec2_sd_discovery (#775) * Add improvements to ec2 discovery https://github.com/VictoriaMetrics/VictoriaMetrics/issues/771 role_arn support with aws sts instance iam_role support refreshing temporary tokens * Apply suggestions from code review Co-authored-by: Roman Khavronenko <[email protected]> * changed implementation, removed tests, clean up code * moved endpoint builder into getEC2APIResponse Co-authored-by: Roman Khavronenko <[email protected]>
commit sha f9618382900f82d91554c9d1e66916ad50ad2d1e
lib/promscrape/discovery/ec2: code prettifying after 312fead9a2e261d470858b8d1ffec7527682dc77
commit sha d32c3f747c383dcc12ce303ad1c5b18a72a8917b
lib/logger: add `-loggerDisableTimestamps` command-line flag for disabling timestamps in logs Updates https://github.com/VictoriaMetrics/VictoriaMetrics/issues/778
push time in 7 days
push eventVictoriaMetrics/VictoriaMetrics
commit sha 964bc7595cc81ce4c52377f0798423ed05509669
lib/promscrape/discovery/ec2: code prettifying after 312fead9a2e261d470858b8d1ffec7527682dc77 Updates https://github.com/VictoriaMetrics/VictoriaMetrics/issues/771
commit sha 29108cc53e42d29a41bc3ff6e70b36a8c5788db2
lib/logger: add `-loggerDisableTimestamps` command-line flag for disabling timestamps in logs Updates https://github.com/VictoriaMetrics/VictoriaMetrics/issues/778
push time in 7 days
issue commentVictoriaMetrics/VictoriaMetrics
remote_write lag and high pending index entries when add a new prometheus remote_write client
It looks like the bottleneck is at vminsert side. Every vminsert node establishes a single connection to every vmstorage node from -storageNode command-line flag list. Data transfer rate for each such vminsert->vmstorage connection is limited by a single CPU core on both sides - vminsert and vmstorage. So, in order to increase the overall bandwidth for incoming data, the following actions might be taken:
- Increasing the number of
vminsertnodes and evenly spreading incoming load among them. - Increasing the number of
vmstoragenodes.
Both these actions increase the number of vminsert->vmstorage connections, so this increases the max data ingestion bandwidth for the cluster. See also capacity planning docs for VictoriaMetrics cluster.

comment created time in 7 days
issue commentVictoriaMetrics/VictoriaMetrics
Three vmstorage nodes occupy different disk space
@saclive , could you verify that all the vminsert nodes in the cluster have the same set of -storageNode command-line flags and these flags have identical order? If this isn't the case, then the data distribution among vmstorage nodes may become uneven.
we find a function named updatemetrics() but it is never be called
This function is called inside registerStorageMetrics() function in app/vmstorage/main.go file in cluster branch - see https://github.com/VictoriaMetrics/VictoriaMetrics/blob/8cd89cb8477dc7fcf003292bcba107bce4208ba7/app/vmstorage/main.go#L222

comment created time in 7 days
issue commentVictoriaMetrics/VictoriaMetrics
How do I know how many time series vm has stored in total?
The /api/v1/series/count counts the number of unique time series by scanning the inverted index containing records for every time series. That's why it may be slow if the number of time series in the database exceeds tens of millions. There is vm_cache_entries{type="storage/hour_metric_ids"} metric, which shows the number of active time series, i.e. time series with recently added samples - see monitoring docs for details. If no new data is ingested for the time series during long periods of time (i.e. more than a hour), then such time series isn't counted by vm_cache_entries{type="storage/hour_metric_ids"} metric.
The total number of time series in the database can be much bigger than the number of active time series if there is high churn rate, i.e. if old time series are constantly substituted by new time series. Time series are uniquely identified by its name plus a set of its' labels. If at least a single label value changes, then new time series is created. For example, foo{bar="baz1"} and foo{bar="baz2"} are distinct time series.
comment created time in 7 days
issue commentVictoriaMetrics/VictoriaMetrics
series count API returns old value after calling delete series API
Closing this question as answered.

comment created time in 7 days