





christopheradams/elixir_style_guide 3748
A community driven style guide for Elixir
elixir-plug/plug 2369
A specification and conveniences for composable modules between web applications
A read-only and immutable MIME type module for Elixir
iOS and Android push notifications for Elixir
Give your JS App some Backbone with Models, Views, Collections, and Events
:paperclip: Flexible file upload and attachment library for Elixir
Golang Amazon Library
PR opened erlang/otp
This commit fixes up misc (minor) spelling and grammatical errors within the profile section of efficiency guide.
pr created time in 8 hours
PR opened erlang/otp
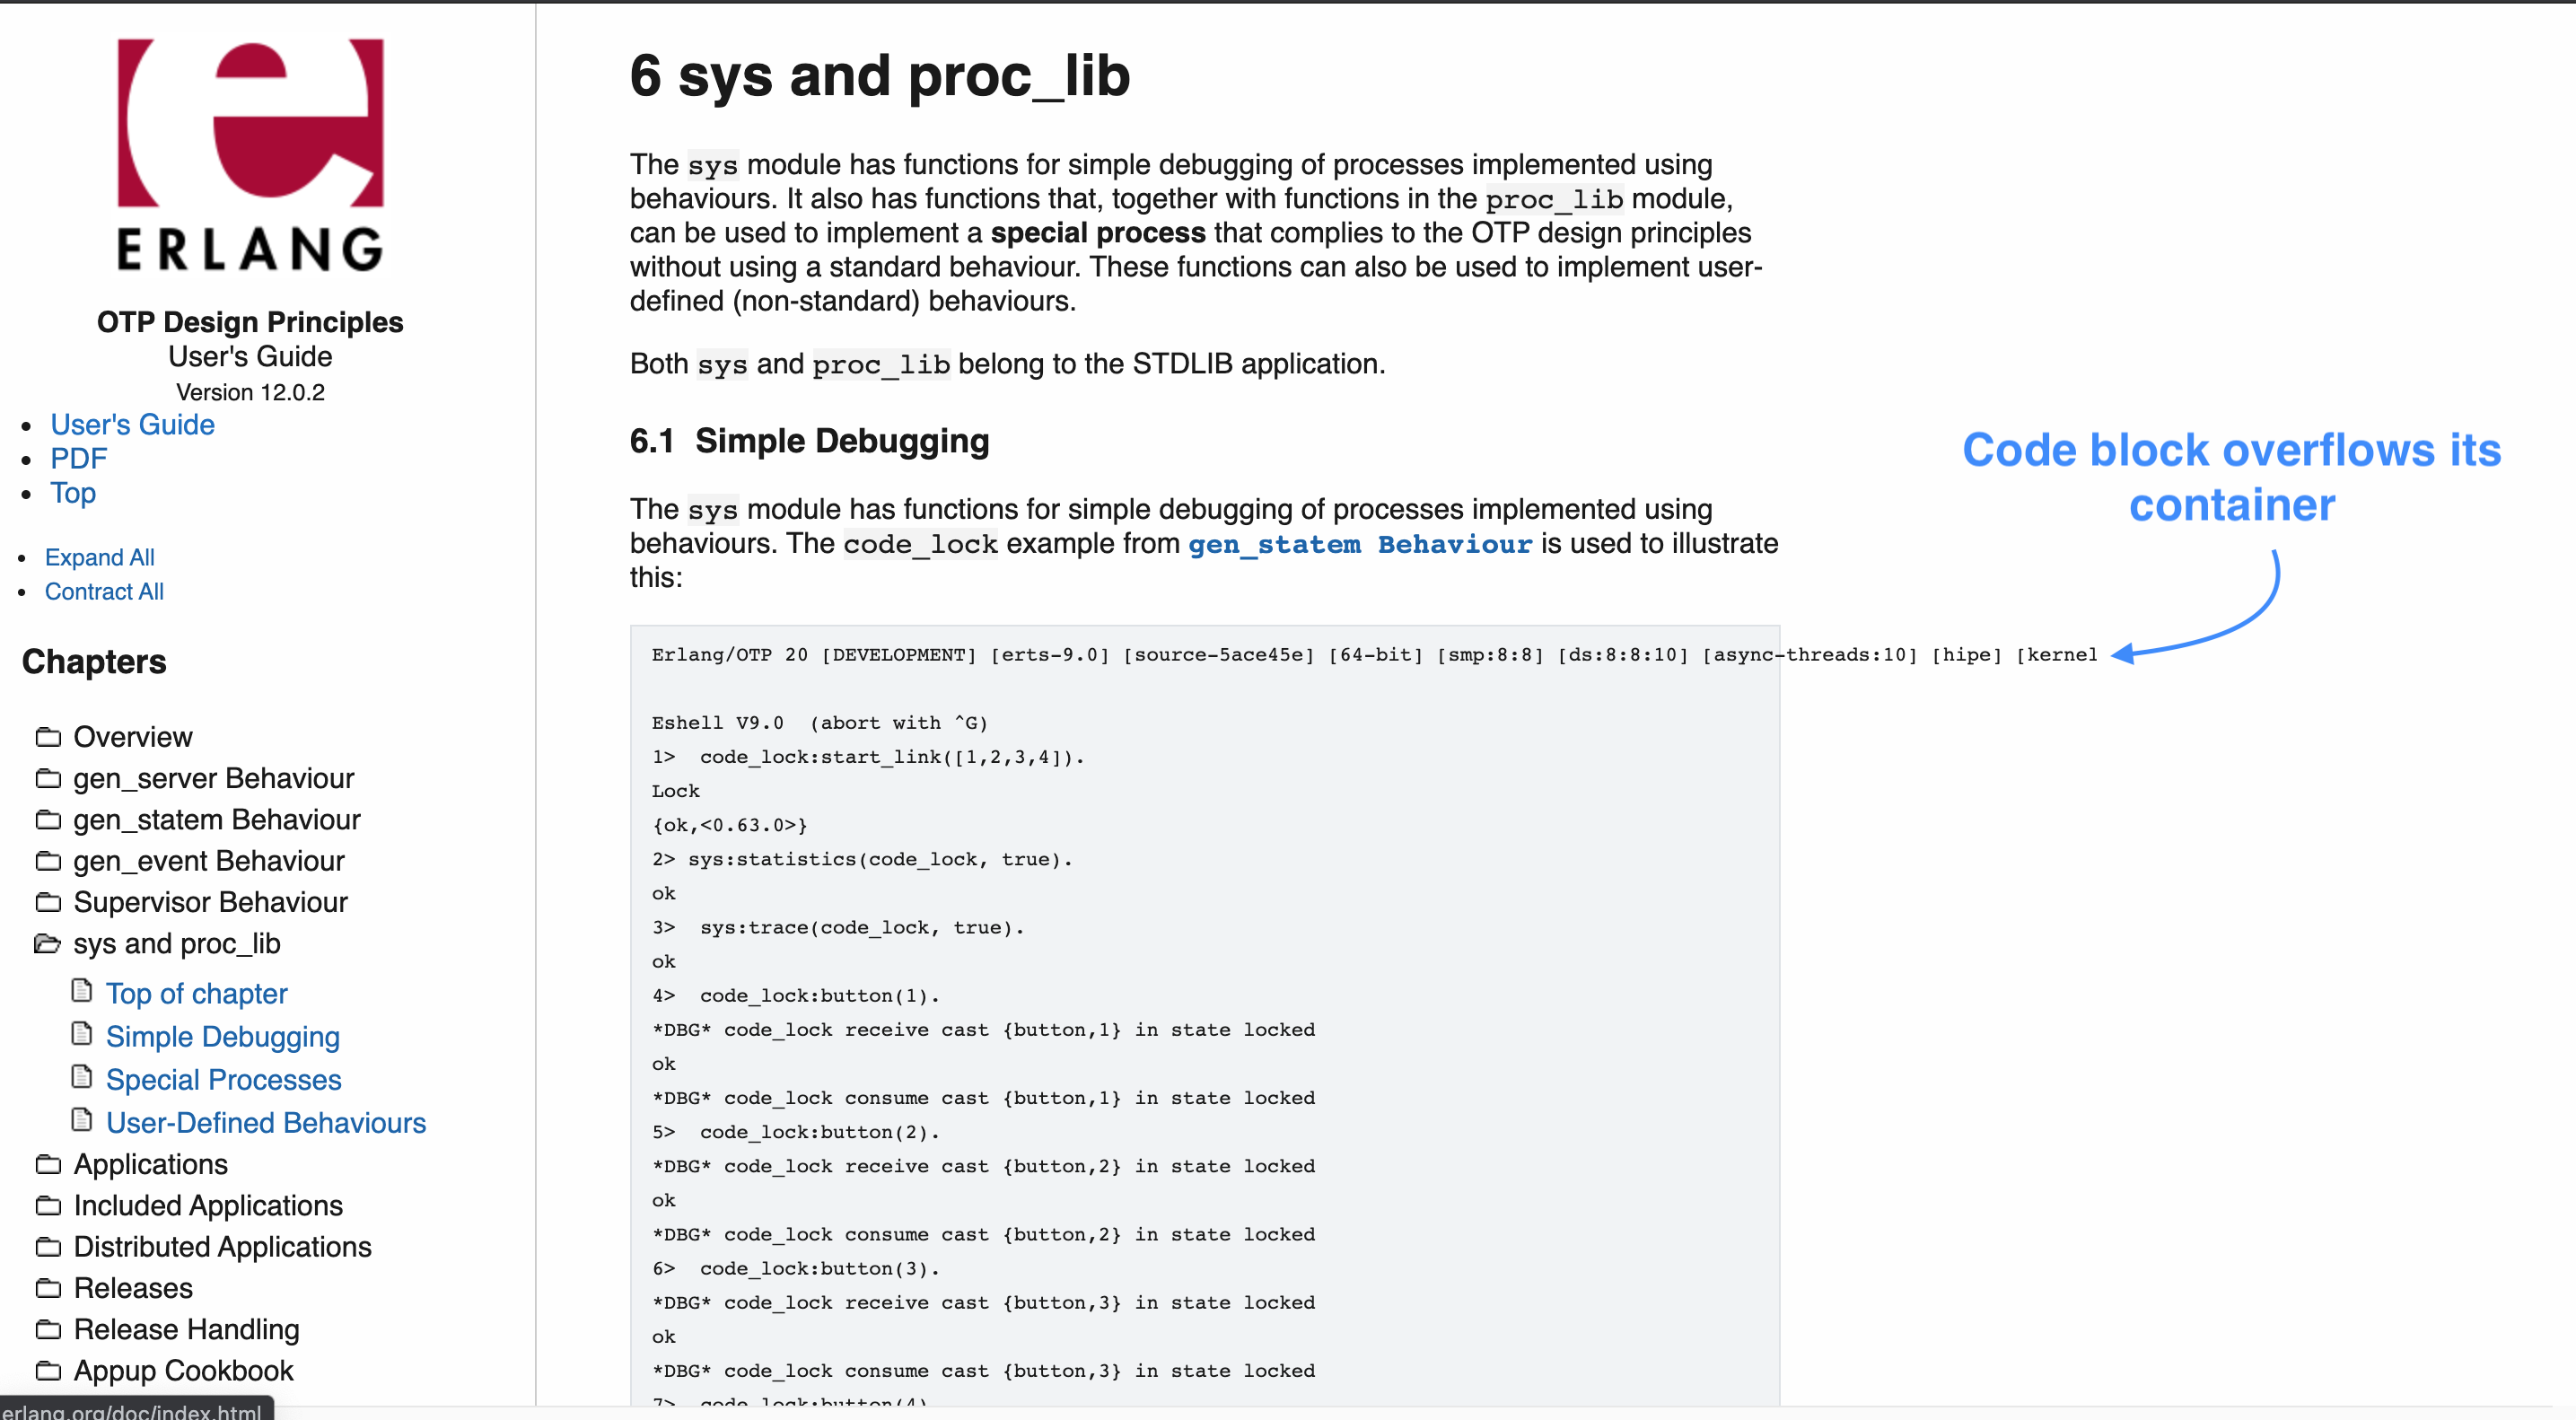
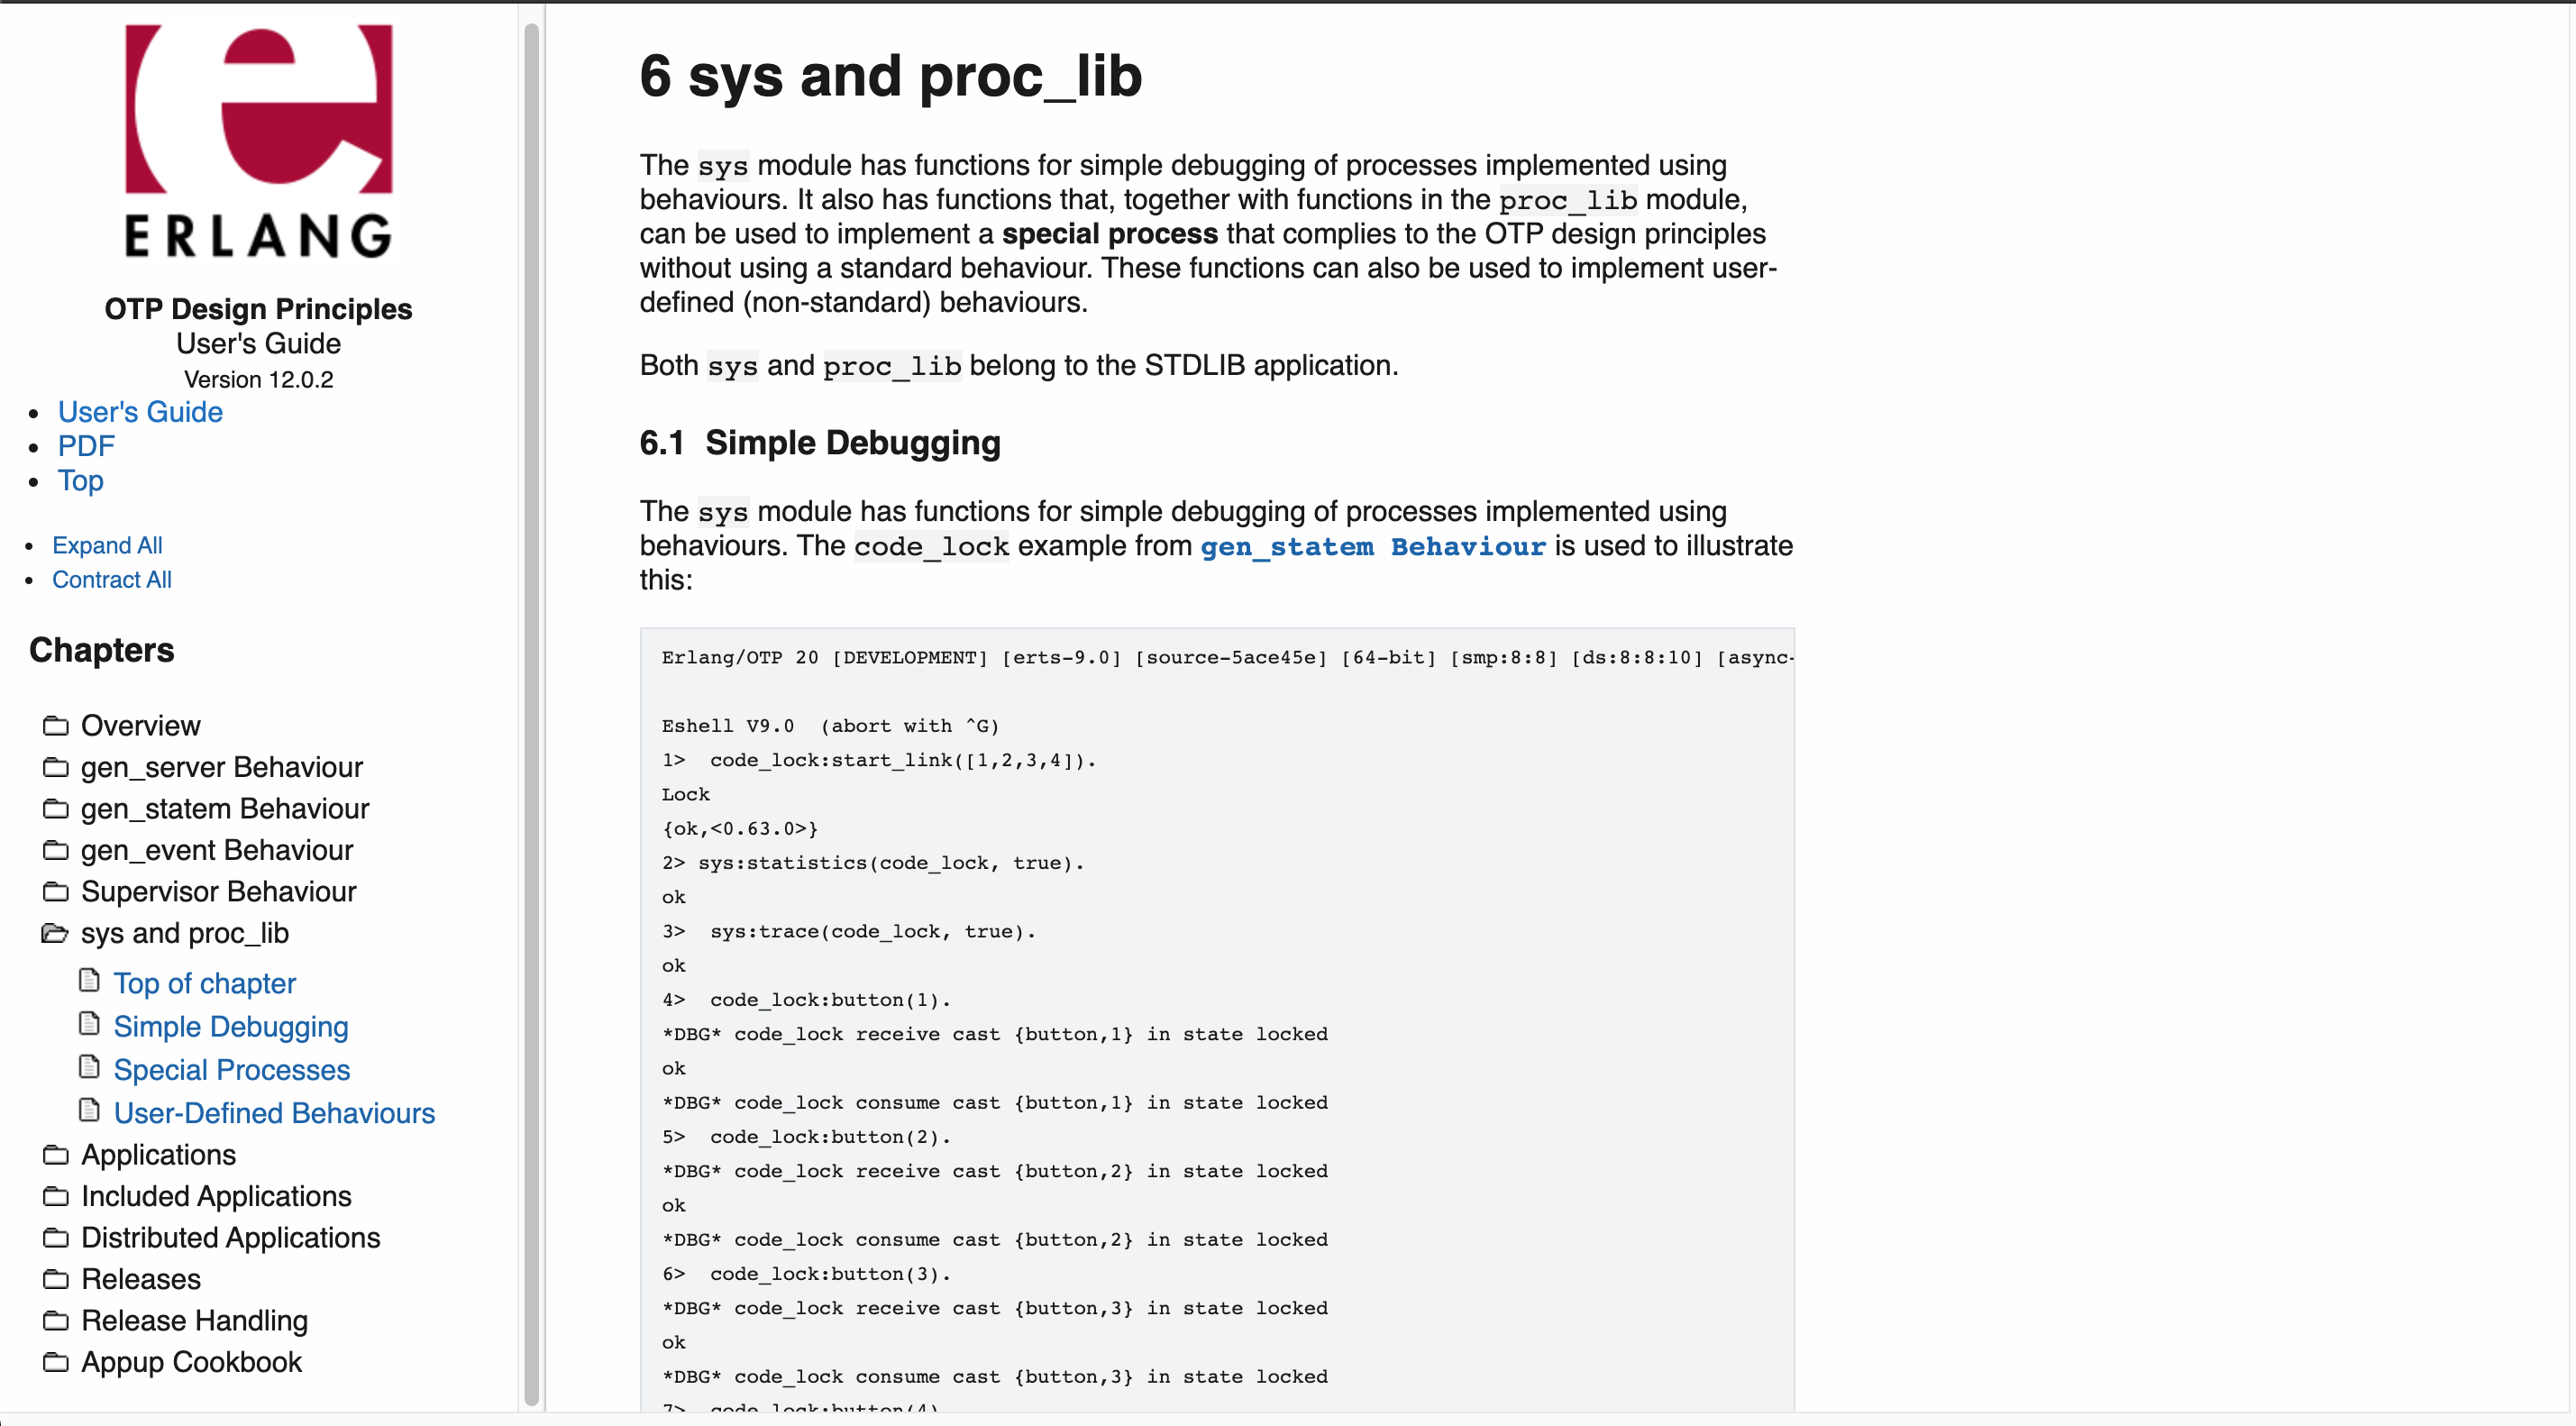
While reading the sys and proc_lib docs, I realised that the code blocks wrapped in a <pre> tag were overflowing its container.
This PR should fix that by enabling horizontal scrolling within code block samples.
Here is some screenshots and video of the before and after this PR.
Before
After
Video of the current solution being applied
https://user-images.githubusercontent.com/2049560/122652658-2bed0d80-d140-11eb-8237-ff062b4fa6a5.mp4
pr created time in 8 hours
issue commenterlang/otp
OTP 23 beam can‘t auto gc on a CentOS 7 server
Thanks but why does not the automatic garbage collec when
total_heap_sizeis greater thanmin_bin_vheap_sizeandfullsweep_after = 0?
These values are not related to each other like that.
total_heap_sizeis the total amount of heap memory allocated, including free heap memory.min_bin_vheap_sizeis minimum virtual heap size for off heap binaries.fullsweep_after = 0is number of generational garbage collections allowed before a fullsweep garbage collection is forced.
because Is
heap_sizeless thantotal_heap_size?
These values are also not related to each other like that.
heap_size is the size of the continues memory block used for the youngest generation heap or only generation heap in case of fullsweep_after = 0. It is very frequently less than total_heap_size also when using fullsweep_after = 0.

comment created time in 11 hours
issue commenterlang/otp
@zerth I force pushed some changes to the PR #4980. It is essentially the same fix with some cosmetic changes, more asserts and a new testcase. This change will be released in the next OTP 24, 23, and 22 patches released.

comment created time in 12 hours
push eventerlang/otp
commit sha ee2dc019cc2bf78cacc15b3be02b8f7100414a61
Fix erlang:system_flag(schedulers_online, _) Simultaneous calls to erlang:system_flag(schedulers_online, _) could cause callers to end up in a suspended state forever.
commit sha ed9019977b96ee23a3b67de7566a62556b96ec1a
Merge branch 'rickard/schedulers-online-fix/GH-4809/OTP-17500' into maint * rickard/schedulers-online-fix/GH-4809/OTP-17500: Fix erlang:system_flag(schedulers_online, _)
commit sha c374c07bf93ac0a619427b0f43455ec651e7c003
Merge branch 'maint' * maint: Fix erlang:system_flag(schedulers_online, _)
push time in 12 hours
push eventerlang/otp
commit sha ee2dc019cc2bf78cacc15b3be02b8f7100414a61
Fix erlang:system_flag(schedulers_online, _) Simultaneous calls to erlang:system_flag(schedulers_online, _) could cause callers to end up in a suspended state forever.
commit sha ed9019977b96ee23a3b67de7566a62556b96ec1a
Merge branch 'rickard/schedulers-online-fix/GH-4809/OTP-17500' into maint * rickard/schedulers-online-fix/GH-4809/OTP-17500: Fix erlang:system_flag(schedulers_online, _)
push time in 12 hours
PR opened erlang/otp
Closes #4985.
pr created time in 12 hours
issue commenterlang/otp
All of the other predicate functions in the lists module expect only true or false, so I would say the same applies to search for consistency. I would also consider the specs to be enough to dictate the behaviour, especially as it matches the implementation, but clarifying the docs shouldn't hurt either.

comment created time in 12 hours
issue commenterlang/otp
openssl 3.0.0 compatible erlang version
erlang team, since openssl beta1 is released, could we have the milestone for the erlang release ?

comment created time in 14 hours
pull request commentelixir-plug/plug
feat: Uses telemetry span for plug.router_dispatch
:green_heart: :blue_heart: :purple_heart: :yellow_heart: :heart:

comment created time in 19 hours
push eventelixir-plug/plug
commit sha 8d86122465fe77ccf3b84cd6abeca6c38a156543
feat: Uses telemetry span for plug.router_dispatch (#1037) Co-authored-by: Isaac Sanders <[email protected]>
push time in 19 hours
issue commentninenines/cowboy
Possible Regression/Leak in Cowboy 2.9
If there was a crash in terminate you would have a log about it. The code hasn't changed much in years, just some minor fixes like removing erlang:get_stacktrace/0. You can always add a few more functions like cowboy_metrics_h:init and terminate, cowboy_stream:make_error_log and cowboy_telemetry_h:metrics_callback. That way you should have a pretty good idea whether there's a crash and log, and where it happens (in cowboy_metrics_h or in cowboy_telemetry_h or beyond).

comment created time in 20 hours
issue commentninenines/cowboy
Possible Regression/Leak in Cowboy 2.9
I setup a trace to trace the following
{:cowboy_telemetry_h, :init, 3},
{:cowboy_telemetry_h, :terminate, 3},
{MyApp.Tracer, :continue_trace, 3},
{MyApp.Tracer, :start_trace, 2},
{MyApp.Tracer, :finish_trace, 0}
MyApp.Tracer is our glue code between telemetry and Spandex.
After a bunch of munging of the data. Most of the traces look like this:
#PID<0.25506.2215>      001624072079398090      cowboy_telemetry_h:init
#PID<0.25506.2215>      001624072079398124      Elixir.MyApp.Tracer:start_trace ["http.request" | _]
#PID<0.25506.2215>      001624072079430092      cowboy_telemetry_h:terminate
#PID<0.25506.2215>      001624072079472165      Elixir.MyApp.Tracer:finish_trace
I found a process stuck in this loop through:
#PID<0.6986.2161>       001624072077862889      cowboy_telemetry_h:init
#PID<0.6986.2161>       001624072077862924      Elixir.MyApp.Tracer:continue_trace ["http.request" | _]
#PID<0.6986.2161>       001624072077880694      cowboy_telemetry_h:terminate
#PID<0.6986.2161>       001624072078261498      cowboy_telemetry_h:init
#PID<0.6986.2161>       001624072078261563      Elixir.MyApp.Tracer:continue_trace ["http.request" | _]
#PID<0.6986.2161>       001624072078279640      cowboy_telemetry_h:terminate
#PID<0.6986.2161>       001624072078469414      cowboy_telemetry_h:init
#PID<0.6986.2161>       001624072078469472      Elixir.MyApp.Tracer:continue_trace ["http.request" | _]
#PID<0.6986.2161>       001624072078550234      cowboy_telemetry_h:terminate
#PID<0.6986.2161>       001624072079042759      cowboy_telemetry_h:init
#PID<0.6986.2161>       001624072079042810      Elixir.MyApp.Tracer:continue_trace ["http.request" | _]
#PID<0.6986.2161>       001624072079098776      cowboy_telemetry_h:terminate
...
It never calls MyApp.Tracer:finish_trace even though cowboy_telemetry_h:terminate was called, before calling init/continue_trace again (which would cause the error log).
I can imagine this is caused by one of a few things:
cowboy_telemetryisn't emitting the telemetry event onterminatecowboy_telemetryis emitting the event, but our handler has disconnected because it crashed- Something is crashing between
terminateandSpandexthat would have caused the Cowboy process to die in 2.8 but is now being gracefully caught and the process is re-used in 2.9
comment created time in a day
issue commenterlang/otp
OTP 23 beam can‘t auto gc on a CentOS 7 server
Thanks
comment created time in a day
issue commenterlang/otp
OTP 23 beam can‘t auto gc on a CentOS 7 server
thanks !
comment created time in a day
issue commenterlang/otp
Cannot reallocate 0 bytes of memory (of type "estack")
You can send the crash dump to rickard at erlang.org

comment created time in a day
issue closederlang/otp
OTP 23 beam can‘t auto gc on a CentOS 7 server
Describe the bug OTP 23 beam can‘t auto gc on a CentOS 7 server,and call 'erlang:garbage_collect' effectively frees the process's memory; and It works on mac
To Reproduce Steps to reproduce the behavior.
Expected behavior after the client establishes a connection to the server, the process takes 40K bytes and does not release it
Affected versions otp 23
Additional context gc.md
closed time in a day
TangYunTao
issue commenterlang/otp
OTP 23 beam can‘t auto gc on a CentOS 7 server
This is not a bug. A process is not garbage collected unless it reach certain limits, for example it needs to allocate heap data and there is no free heap available. If a process stops executing, it does not matter how long time passes, it wont automatically garbage collect by itself unless it reaches one of these limits.
comment created time in a day
issue commenterlang/otp
ssl psk ciphers options break between ssl 9.2 and 10.1
There seems to be a larger problem with option handling. After changing the options to look like this:
    SslOptions = [
                  { verify, verify_none },
                  { psk_identity, "TESTID" },
                  { versions, [ 'tlsv1.2' ] },
                  { user_lookup_fun, { fun psk_lookup/3, nil } },
                  { ciphers, [
                              #{
                                cipher => aes_128_cbc,
                                key_exchange => psk,
                                mac => sha,
                                prf => default_prf
                               }
                             ]
                  }
                 ],
I run the same test using a docker container based on alpine, which does not include and ca-certificates by default and the error produced was:
=WARNING REPORT==== 18-Jun-2021::19:32:38.925569 ===
Description: "Authenticity is not established by certificate path validation"
     Reason: "Option {verify, verify_peer} and cacertfile/cacerts is missing"
But {verify, verify_none} is set. Using versions [ 'tlsv1.2' ] did not alter the outcome.

comment created time in a day
pull request commenterlang/otp
@lagebr you need to do a rebase --onto and force push your branch, moving things backwards with github button does not work I am afraid.

comment created time in a day
issue commentninenines/cowboy
Possible Regression/Leak in Cowboy 2.9
Not willingly, in any case.
You can check if that is the case by tracing exclusively on the init/terminate callbacks. Trace to a file and then check that it is full of init followed by terminate.
comment created time in a day
issue commentninenines/cowboy
Possible Regression/Leak in Cowboy 2.9
I captured the state of two processes (actually the same process twice) that were getting high reductions:
#state{
	parent = <0.4943.0>,
	ref = MyAppWeb.Endpoint.HTTP,
	socket = #Port<0.4067799>,
	transport = :ranch_tcp,
	proxy_header = undefined,
	opts = #{} :: #{env =>
          #{dispatch =>
                [{'_',[],
                     [{'_',[],'Elixir.Phoenix.Endpoint.Cowboy2Handler',
                          {'Elixir.MyApp.Endpoint',[]}}]}]},
      idle_timeout => 70000,max_keepalive => 20000,
      stream_handlers => [cowboy_telemetry_h,cowboy_stream_h]},
	buffer = <<>>,
	overriden_opts = #{},
  peer = {{0,0,0,0,0,65535,44051,33230},1060},
  sock = {{0,0,0,0,0,65535,44049,7},4080},
	cert = undefined,
	timer = #Reference<0.327935682.2040528927.255668>,
	active = true,
	in_streamid = 286,
	in_state = #ps_request_line{empty_lines=0},
	flow = infinity,
	out_streamid = 286,
	out_state = wait,
	last_streamid = 20000,
	streams = [],
	children = []
}
#state{
	parent = <0.4943.0>,
	ref = MyAppWeb.Endpoint.HTTP,
	socket = #Port<0.3982394>,
	transport = :ranch_tcp,
	proxy_header = undefined,
	opts = #{} :: #{env =>
          #{dispatch =>
                [{'_',[],
                     [{'_',[],'Elixir.Phoenix.Endpoint.Cowboy2Handler',
                          {'Elixir.MyApp.Endpoint',[]}}]}]},
      idle_timeout => 70000,max_keepalive => 20000,
      stream_handlers => [cowboy_telemetry_h,cowboy_stream_h]},
	buffer = <<>>,
	overriden_opts = #{},
  peer = {{0,0,0,0,0,65535,44051,33230},54968},
  sock = {{0,0,0,0,0,65535,44049,7},4080},
	cert = undefined,
	timer = #Reference<0.327935682.2040528924.235998>,
	active = true,
	in_streamid = 1962,
	in_state = #ps_request_line{empty_lines=0},
	flow = infinity,
	out_streamid = 1961,
	out_state = wait,
	last_streamid = 20000,
	streams = [#stream{
        id = 1961,
        state = #cowboy_telemetry_h{...},
        method = "POST",
        version = "HTTP/1.1",
        te :: undefined ,
        local_expected_size = undefined,
        local_sent_size = 0 ,
        queue = []
    }],
	children = [#child{
        pid = #PID<0.22534.478>,
        streamid = 1961,
        shutdown = 5000,
        timer = undefined
    }]
}
Nothing really jumps out at me with those two processes. One thing I did notice this time though is that the process with the top number of reductions is often the logger:
iex(socialx@2a4a976d3e85)36> :recon.proc_window(:reductions, 5, 5000)
[
  {#PID<0.4621.0>, 1681468,
   [
     Logger,
     {:current_function, {:gen_event, :fetch_msg, 6}},
     {:initial_call, {:proc_lib, :init_p, 5}}
   ]},
  {#PID<0.29288.479>, 205943,
   [
     current_function: {:cowboy_http, :loop, 1},
     initial_call: {:proc_lib, :init_p, 5}
   ]},
   ...
]
This probably correlates with a massive uptick we're seeing in error logs coming from our telemetry code. Our current telemetry setup is: cowboy -> cowboy_telemetry -> telemetry -> some internal glue code -> Spandex
Spandex has an error log that we hit a lot during these:
Logger.error("Tried to start a trace over top of another trace. name: #{inspect(name)}")
https://github.com/spandex-project/spandex/blob/d14f78ce416ccedc2b16e0acd1927809e626ca30/lib/spandex.ex#L40
The error happens when there is already an open Spandex trace in the process dict (which I believe would be the cowboy_http process).
We attempt to continue the trace as a result of the telemetry event [cowboy, request, start] which cowboy_telemetry fires from the init call of the cowboy_telemetry_h stream handler.
All this brings me to ask - did something change in 2.9 that would cause init function of a handler to be called multiple times or the metrics_callback (which stops the trace) to not be called before the next init is called?
comment created time in a day
issue openederlang/otp
Describe the bug
The man page for lists (lib/stdlib/doc/src/lists.xml) describes the lists:search/2 function as
search(Pred, List) -> {value, Value} | falseIf there is aValueinListsuch thatPred(Value)returnstrue, returns{value, Value}for the first suchValue, otherwise returnsfalse.
This makes no mention whatsoever about what the Pred(Value) call needs to return if it does not return true, so all values which are not the atom true should be valid according to that description.
However, the implementation of lists:search/2 in lib/stdlib/src/lists.erl is more strict and insists that Pred(Value) MUST return either the atom true or the atom false, which is also reflected by its -spec specifying a boolean() return value.
-spec search(Pred, List) -> {value, Value} | false when
      Pred :: fun((T) -> boolean()),
      List :: [T],
      Value :: T.

search(Pred, [Hd|Tail]) ->
    case Pred(Hd) of
        true -> {value, Hd};
        false -> search(Pred, Tail)
    end;
search(Pred, []) when is_function(Pred, 1) ->
    false.
To Reproduce
Run this script:
#!/usr/bin/env escript
%% -*- erlang -*-

main([]) ->
    lists:search(fun(X) ->
			 case X rem 2 of
			     0 -> true;
			     _ -> odd
			 end
		 end,
		 [5,1,3,2,9,14]),
    ok.
[user@host ~]$ escript lists-search-pred-values
escript: exception error: no case clause matching odd
  in function  lists:search/2 (lists.erl, line 1412)
  in call from erl_eval:do_apply/6 (erl_eval.erl, line 680)
  in call from escript:eval_exprs/5 (escript.erl, line 872)
  in call from erl_eval:local_func/6 (erl_eval.erl, line 567)
  in call from escript:interpret/4 (escript.erl, line 788)
  in call from escript:start/1 (escript.erl, line 277)
  in call from init:start_em/1
  in call from init:do_boot/3
[user@host ~]$
Yes, this example fun may look a bit contrived, but with a number of OTP functions such as lists:search/2 or lists:keysearch/3 returning either {value, Value} or false, there are certainly precedents for a function returning either a boolean value or something that is not a boolean value at all not being very unusual.
Expected behavior
If the documentation is correct, the escript should run without throwing an exception.
Affected versions
All OTP versions since the introduction of lists:search/2 which, according to lists.xml, was OTP 21.0. In my case, OTP 23.
Additional context
I see two ways to fix this:
- either fix the documentation to explicitly demand that
Pred(Value)needs to return eithertrueorfalse - or fix the implementation (and the
-spec) to allow for any non-truevalue to be interpreted as currentlyfalseis
There are arguments for both ways. Fixing the implementation appears to allow all non-true values appears to be the more Erlang-y way to me, though, and should change much in the code (not sure whether the -spec for Pred is a good way to express this, though):
-spec search(Pred, List) -> {value, Value} | false when
      Pred :: fun((T) -> true | term()),
      List :: [T],
      Value :: T.

search(Pred, [Hd|Tail]) ->
    case Pred(Hd) of
        true -> {value, Hd};
        _ -> search(Pred, Tail)
    end;
search(Pred, []) when is_function(Pred, 1) ->
    false.
created time in a day
Pull request review commenterlang/otp
Clean up and support reuse of distribution capability bits
-define(DFLAG_EXIT_PAYLOAD, 16#400000). -define(DFLAG_FRAGMENTS, 16#00800000). -define(DFLAG_HANDSHAKE_23, 16#01000000).--define(DFLAG_RESERVED, 16#fe000000).--define(DFLAG_SPAWN, 16#100000000).--define(DFLAG_NAME_ME, 16#200000000).--define(DFLAG_V4_NC, 16#400000000).--define(DFLAG_ALIAS, 16#800000000).+-define(DFLAG_MANDATORY_25, 16#04000000).
-define(DFLAG_UNLINK_ID, 16#02000000).
-define(DFLAG_MANDATORY_25, 16#04000000).
I seem to have forgotten the DFLAG_UNLINK_ID flag here...

comment created time in a day
Pull request review commenterlang/otp
Clean up and support reuse of distribution capability bits
-define(ERL_DIST_VER_LOW, ?ERL_DIST_VER_5). -define(ERL_DIST_VER_HIGH, ?ERL_DIST_VER_6). +%%%+%%% To avoid having to extend the number of distribution flags from 64+%%% to 128, an scheme for garbage collection of the flags was
%%% to 128, a scheme for garbage collection of the flags was
comment created time in a day
Pull request review commenterlang/otp
Clean up and support reuse of distribution capability bits
#define DFLAG_DIST_STRICT_ORDER DFLAG_DIST_HDR_ATOM_CACHE /* All flags that should be enabled when term_to_binary/1 is used. */-#define TERM_TO_BINARY_DFLAGS (DFLAG_EXTENDED_REFERENCES \- | DFLAG_NEW_FUN_TAGS \- | DFLAG_NEW_FLOATS \- | DFLAG_EXTENDED_PIDS_PORTS \- | DFLAG_EXPORT_PTR_TAG \- | DFLAG_BIT_BINARIES \- | DFLAG_MAP_TAG \- | DFLAG_BIG_CREATION)+#define TERM_TO_BINARY_DFLAGS DFLAG_NEW_FLOATS
#define TERM_TO_BINARY_DFLAGS 0
Since DFLAG_NEW_FLOATS now are mandatory, or maybe I'm missing something?
comment created time in a day
Pull request review commenterlang/otp
Clean up and support reuse of distribution capability bits
dflag2str(?DFLAG_FRAGMENTS) -> "FRAGMENTS"; dflag2str(?DFLAG_HANDSHAKE_23) -> "HANDSHAKE_23";
    "HANDSHAKE_23";
dflag2str(?DFLAG_UNLINK_ID) ->
    "UNLINK_ID";
I seem to have forgotten the DFLAG_UNLINK_ID flag here...
comment created time in a day